$219.00 Original price was: $219.00.$149.00Current price is: $149.00.
Streamline your financial modeling process with our customizable Standard Financial Model Template. Save time and effort with pre-built formulas, formatting, and structure. Create accurate projections and make informed decisions.
Description
Many businesses struggle with forecasting, budgeting, and understanding their financial health. Without a clear, structured approach, it’s easy to make assumptions that lead to costly mistakes. Forecasting revenue, tracking expenses, and planning for growth can quickly become overwhelming, especially as your business expands. You need a way to make sense of complex financial data and translate it into actionable insights that drive decision-making.
This is where our Financial Model Template comes in. It provides a clear, easy-to-use framework that streamlines your financial planning process. With pre-built formulas and customizable assumptions, the template allows you to forecast revenue, track expenses, and measure profitability with confidence. Whether you’re preparing for investment, setting a budget, or evaluating future growth, this template ensures that your financial projections are grounded in data and aligned with your business goals. By simplifying the modeling process, it helps you make informed decisions, plan for various scenarios, and manage risks more effectively—ultimately enabling you to grow your business with greater precision and control.
Financial modeling is the art and science of creating a quantitative representation of a business’s financial performance. It involves building models that predict future financial outcomes based on various assumptions about revenue, expenses, and other factors that drive profitability. A financial model is like a roadmap for decision-makers, helping them visualize where the company is headed and providing insights into key financial metrics. Whether you’re a business owner, investor, or analyst, understanding financial modeling is essential for making informed, data-driven decisions.
What is Financial Modeling?
Financial modeling is a process that involves creating a mathematical representation of a business’s financial operations. This model can be used to forecast future financial performance by analyzing historical data, making assumptions about future conditions, and applying formulas to predict outcomes. Essentially, it’s a way of simulating a company’s financial environment, projecting its future performance, and understanding the impact of different business decisions.
The most common type of financial model is a spreadsheet-based model, often built using Excel or Google Sheets. Financial modeling uses various financial statements, including the income statement, balance sheet, and cash flow statement, to track performance and forecast future outcomes. Models often include key performance indicators (KPIs) like return on investment (ROI), profit margins, and cash flow metrics to measure the financial health of a business.
The models are built by linking different financial components together, ensuring that changes in one area (such as a change in revenue or costs) are reflected throughout the entire model. These models can be used for a variety of purposes, including business planning, budgeting, investment analysis, and valuation.
What is a Financial Model?
A financial model is a detailed, quantitative representation of a company’s financial situation that helps predict future performance. Typically built in spreadsheets, financial models take into account past financial data and project it forward, incorporating assumptions about factors like sales growth, expenses, and market conditions.
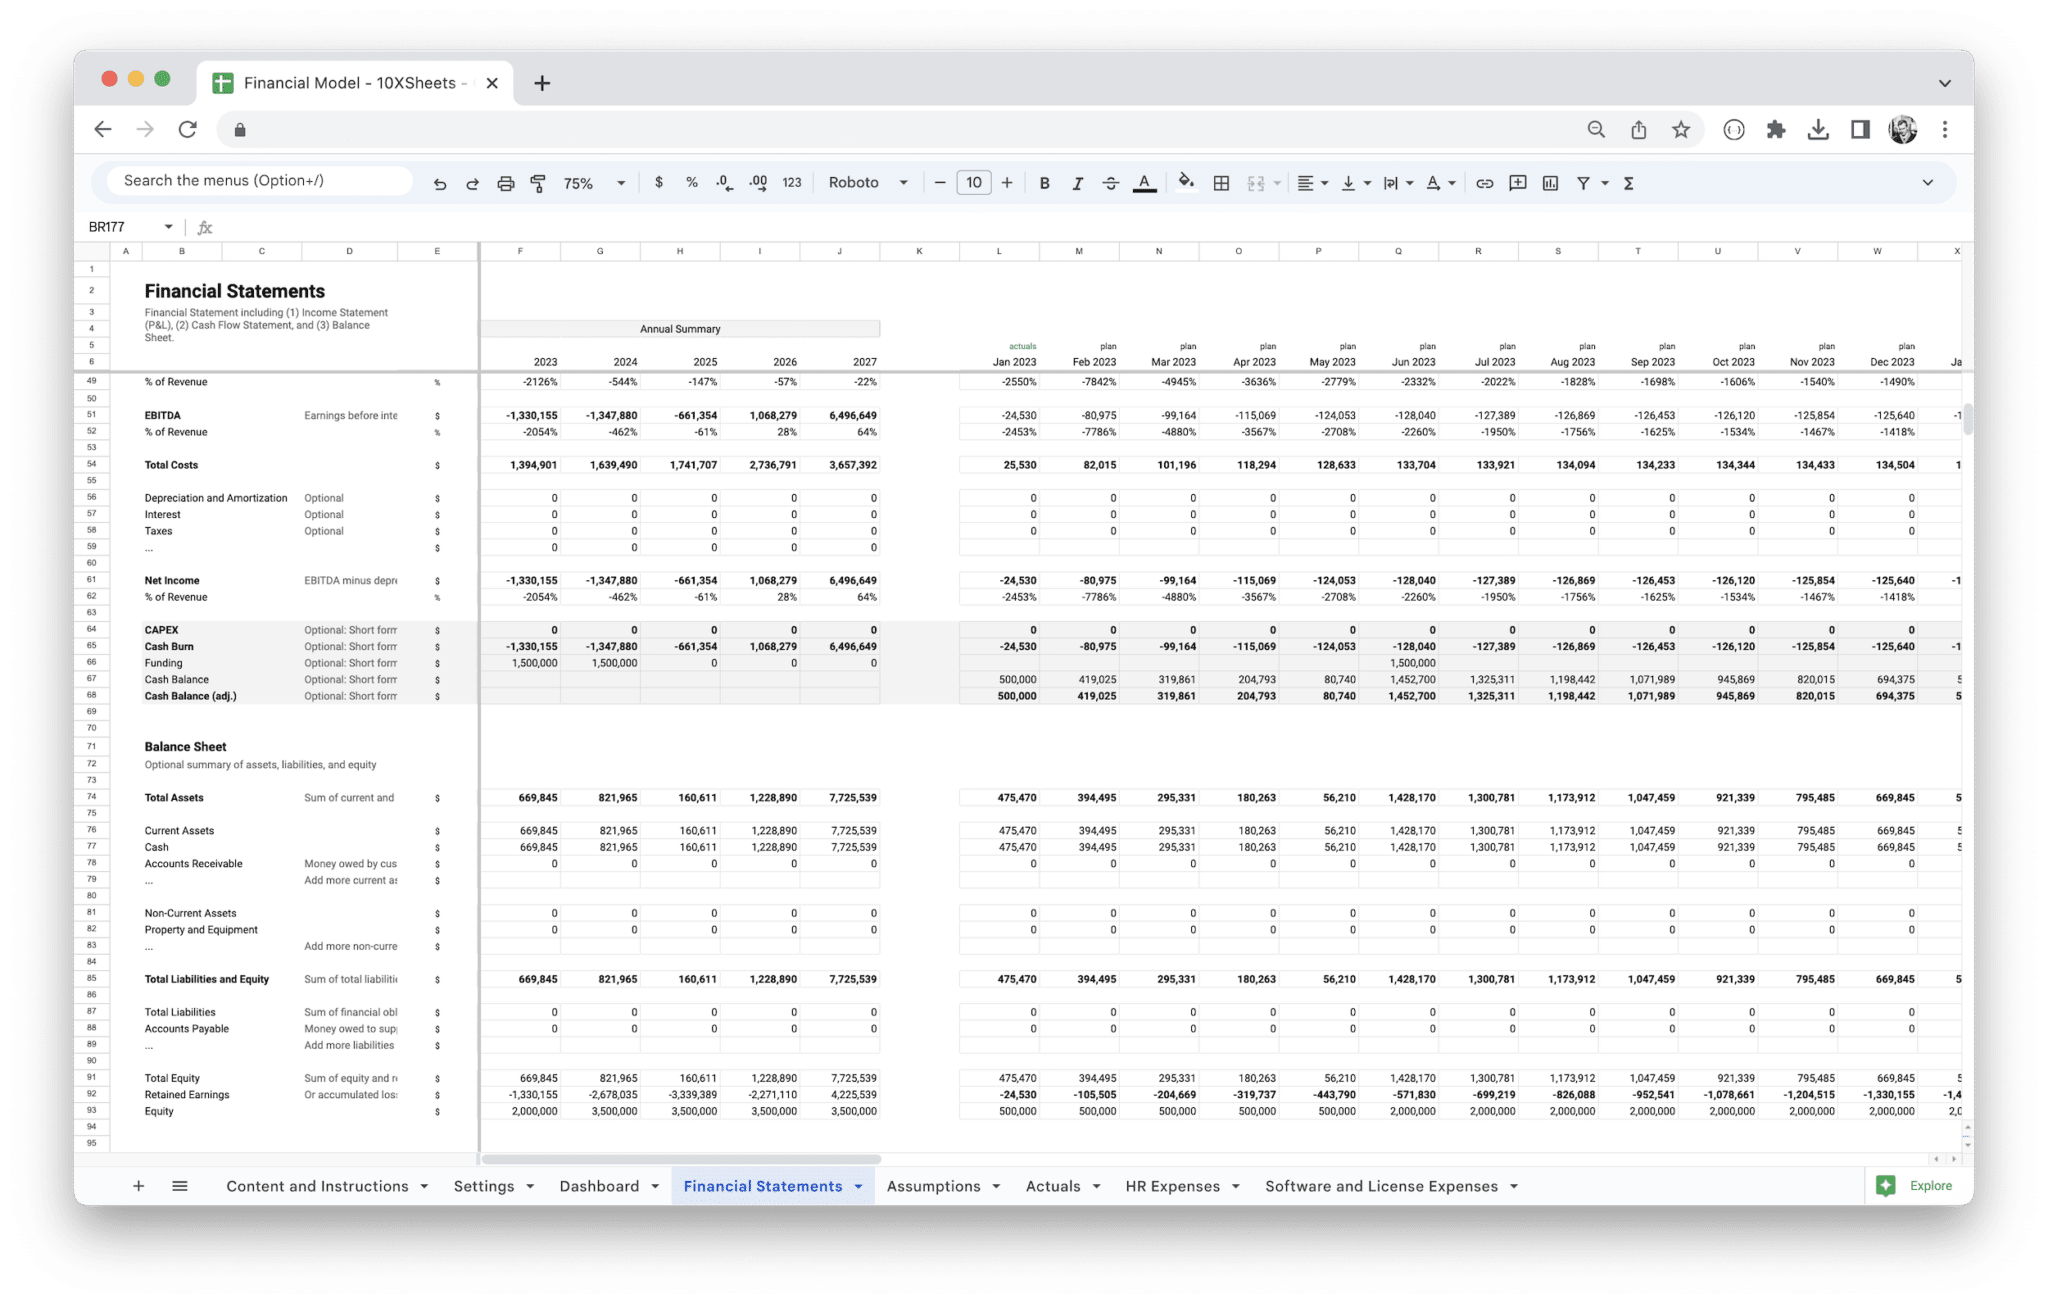
At its core, a financial model includes at least three primary financial statements:
- Income Statement: This tracks revenues, expenses, and profits over a specific period.
- Balance Sheet: This provides a snapshot of a company’s financial position at a given point in time, showing its assets, liabilities, and equity.
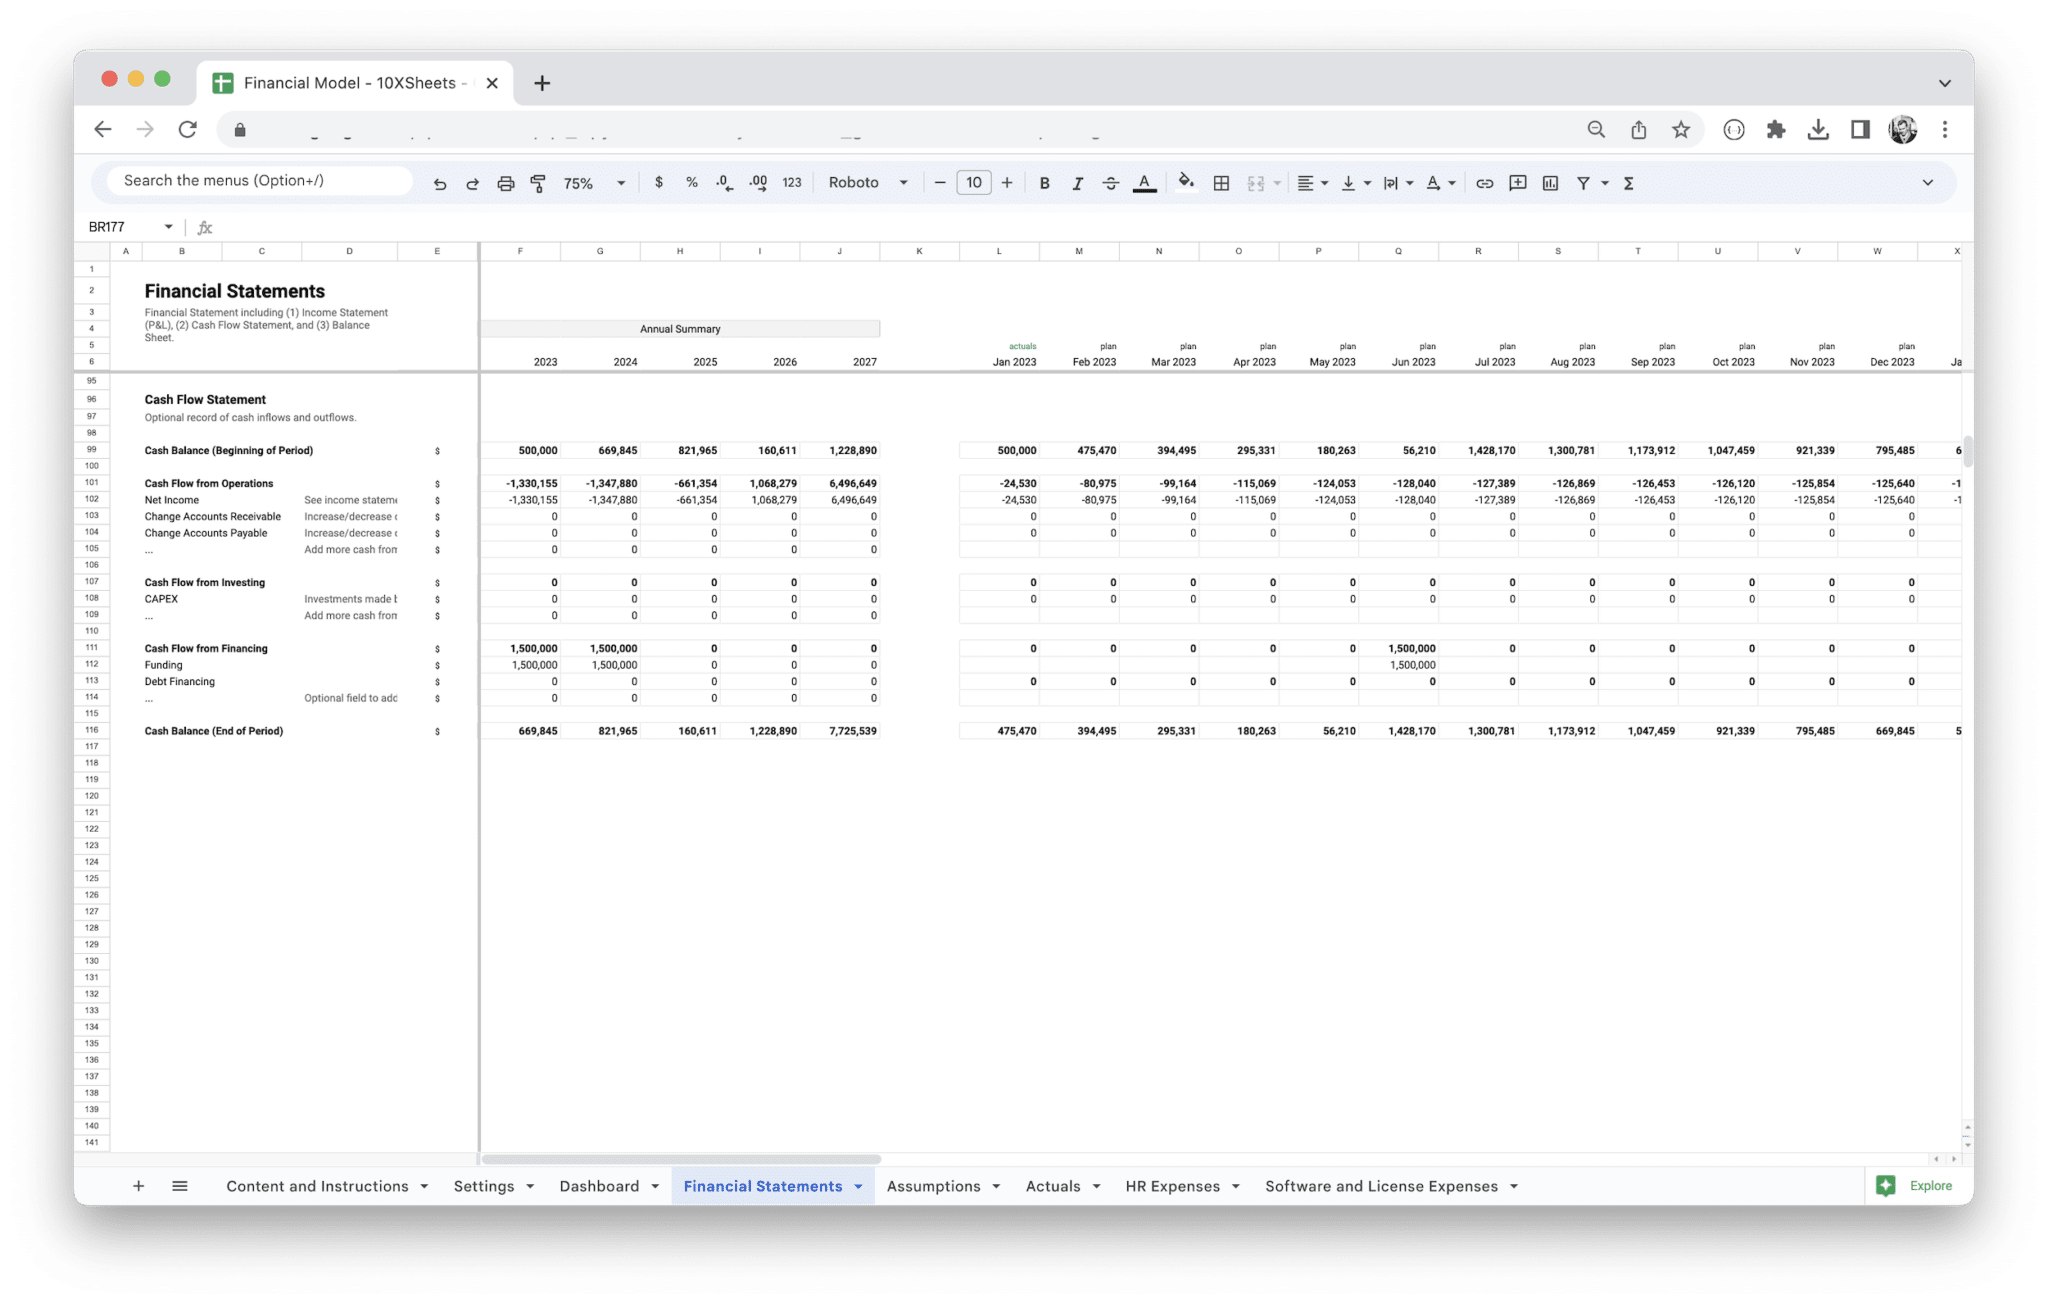
- Cash Flow Statement: This shows the inflow and outflow of cash in a business over a period, highlighting its liquidity position.
A well-designed financial model not only forecasts future performance based on key assumptions but also allows for scenario analysis, enabling decision-makers to explore different possibilities based on changing conditions. It may include additional metrics, such as valuation analysis, cost forecasting, or sensitivity analysis, depending on the model’s purpose.
Financial models are invaluable for businesses seeking to make strategic decisions, attract investors, manage risks, or optimize operations. They offer a comprehensive view of a business’s financial health and help quantify the impact of future decisions on profitability, cash flow, and other key metrics.
Importance of Financial Models in Business
A strong financial model serves as a vital tool for a variety of business functions. It provides clarity, structure, and precision to decision-making, ensuring that all stakeholders are aligned in their understanding of financial projections. Here are a few reasons why financial models are important for businesses:
- Better Decision Making: Financial models allow businesses to simulate various scenarios and assess their potential outcomes, enabling informed decisions that lead to improved business strategies.
- Attracting Investors and Stakeholders: Investors require financial models to understand a business’s future growth prospects, profitability, and financial health. A solid financial model is crucial for raising capital and gaining investor confidence.
- Financial Planning and Budgeting: Financial models provide a clear view of expected revenues, costs, and cash flow, helping businesses plan and allocate resources effectively for future growth.
- Risk Management: By running various scenarios through a financial model, businesses can assess potential risks and determine how to mitigate them before they become significant issues.
- Operational Efficiency: A financial model highlights key performance indicators (KPIs) that measure operational effectiveness, helping businesses identify areas where improvements can be made, such as cost-cutting or revenue enhancement strategies.
- Forecasting Future Performance: Financial models help businesses project future financial outcomes based on data and assumptions, providing a roadmap for growth and profitability.
- Business Valuation: For businesses seeking investment or planning an exit strategy, financial models are essential for determining the company’s valuation and the expected return on investment (ROI) for potential buyers or investors.
Overview of Standard Financial Models
Standard financial models are templates or frameworks that provide the foundation for building a company’s financial forecast. These models often include basic financial statements and assumptions that are applicable to a wide range of businesses. They can be easily customized to suit the needs of different companies and industries. Here’s an overview of some common types of standard financial models:
- Three-Statement Model: This is the simplest type of financial model, consisting of the income statement, balance sheet, and cash flow statement. It’s commonly used for basic financial forecasting and budgeting, providing a comprehensive snapshot of the company’s financial position.
- Discounted Cash Flow (DCF) Model: The DCF model is used to value a business by estimating its future cash flows and discounting them to their present value. This model is commonly used for investment analysis, particularly when valuing companies or projects with predictable cash flows.
- Mergers and Acquisitions (M&A) Model: This model is used when evaluating the financial implications of merging or acquiring a company. It helps assess synergies, potential cost savings, and the impact on the combined entity’s financial health.
- Leveraged Buyout (LBO) Model: The LBO model is used to assess the financial feasibility of a leveraged buyout, where a company is acquired primarily using debt. This model is designed to evaluate the potential return on equity and debt repayment scenarios.
- Budgeting and Forecasting Model: This model focuses on projecting a company’s revenues, expenses, and cash flow for future periods based on assumptions such as market growth, cost management, and investment plans. It’s commonly used for long-term financial planning and resource allocation.
- Consolidation Model: This model is used for companies with multiple business units or subsidiaries. It consolidates the financial data from each unit into a single set of financial statements, enabling management to view the performance of the entire organization in one place.
- Project Finance Model: Often used for large infrastructure or capital projects, this model focuses on evaluating the financial viability of a specific project by analyzing cash inflows, outflows, financing, and returns over the project’s life cycle.
- Sensitivity and Scenario Analysis Models: These models allow for the testing of different assumptions and variables to assess how changes in key inputs (like sales growth or cost of goods sold) affect financial performance. They are often used for risk analysis and decision-making under uncertainty.
Each of these models is tailored to a specific purpose but is grounded in the same fundamental principles of financial analysis. Depending on your business needs, you can customize a standard financial model template to include more detailed metrics or modify assumptions to reflect your unique financial situation. Ultimately, the goal of any financial model is to provide clarity, reduce uncertainty, and guide business decision-making based on data and projections.
Using a standard financial model template offers numerous advantages that streamline the process of financial forecasting, analysis, and decision-making. These templates provide a structured and proven framework that saves time, ensures consistency, and helps you navigate complex financial scenarios with ease.
- Time Efficiency: A pre-built template reduces the time it takes to create a financial model from scratch. With predefined structures and formulas, you can focus on inputting your data and making assumptions, rather than worrying about setting up the layout and structure of the model.
- Consistency and Accuracy: Standard templates ensure that all components of your model are aligned, helping you maintain consistency in your financial projections. This is especially important when you need to track multiple metrics over time or share the model with other stakeholders. The structured approach minimizes human errors and ensures your calculations are accurate.
- Ease of Use: Templates are designed to be user-friendly, even for individuals who may not have advanced financial modeling experience. The familiar structure makes it easier to understand and navigate, regardless of your financial expertise.
- Scalability: As your business grows, a financial model template can be easily adjusted to accommodate changes in assumptions, growth rates, or market conditions. Whether you’re expanding into new markets, introducing new product lines, or raising capital, the template adapts to your evolving needs.
- Customization: While templates come with predefined structures, they are highly customizable. You can modify key assumptions, adjust data inputs, or even add new components based on your unique business needs. This flexibility ensures that the template remains relevant as your business evolves.
- Investor Confidence: A well-structured financial model based on a standard template can help increase investor confidence. Investors appreciate clear, professional financial projections that demonstrate your understanding of key financial metrics and trends. A polished, consistent model can be the difference between securing funding and missing an opportunity.
- Scenario Analysis: Many standard templates come equipped with built-in features that enable you to run scenario analyses, helping you evaluate different business conditions and predict the financial impact of changes. This allows you to make informed decisions and prepare for a range of possible outcomes.
- Data-Driven Decision Making: A financial model template provides a data-driven approach to decision-making. By using a template, you ensure that your projections are based on realistic assumptions, historical data, and market research, rather than guesswork or intuition.
- Cost-Effective: Instead of hiring a financial expert to create a model from the ground up, a template offers a cost-effective alternative. Many templates are available at low cost or even for free, providing an affordable way to generate high-quality financial projections.
- Improved Forecasting and Budgeting: A financial model template can significantly enhance your ability to forecast revenue, track expenses, and manage cash flow. With accurate financial projections in place, you can develop more reliable budgets, allocate resources effectively, and avoid financial surprises.
A financial model is a complex yet structured representation of your business’s financial future, and its strength lies in how well each component interrelates. While every model varies based on specific business needs, most financial models share a few essential components: the income statement, balance sheet, cash flow statement, and the assumptions that drive them. These components help you understand the overall health of your business, predict future performance, and make informed decisions. Let’s take a deeper dive into these key elements and explore their role in building a reliable financial model.
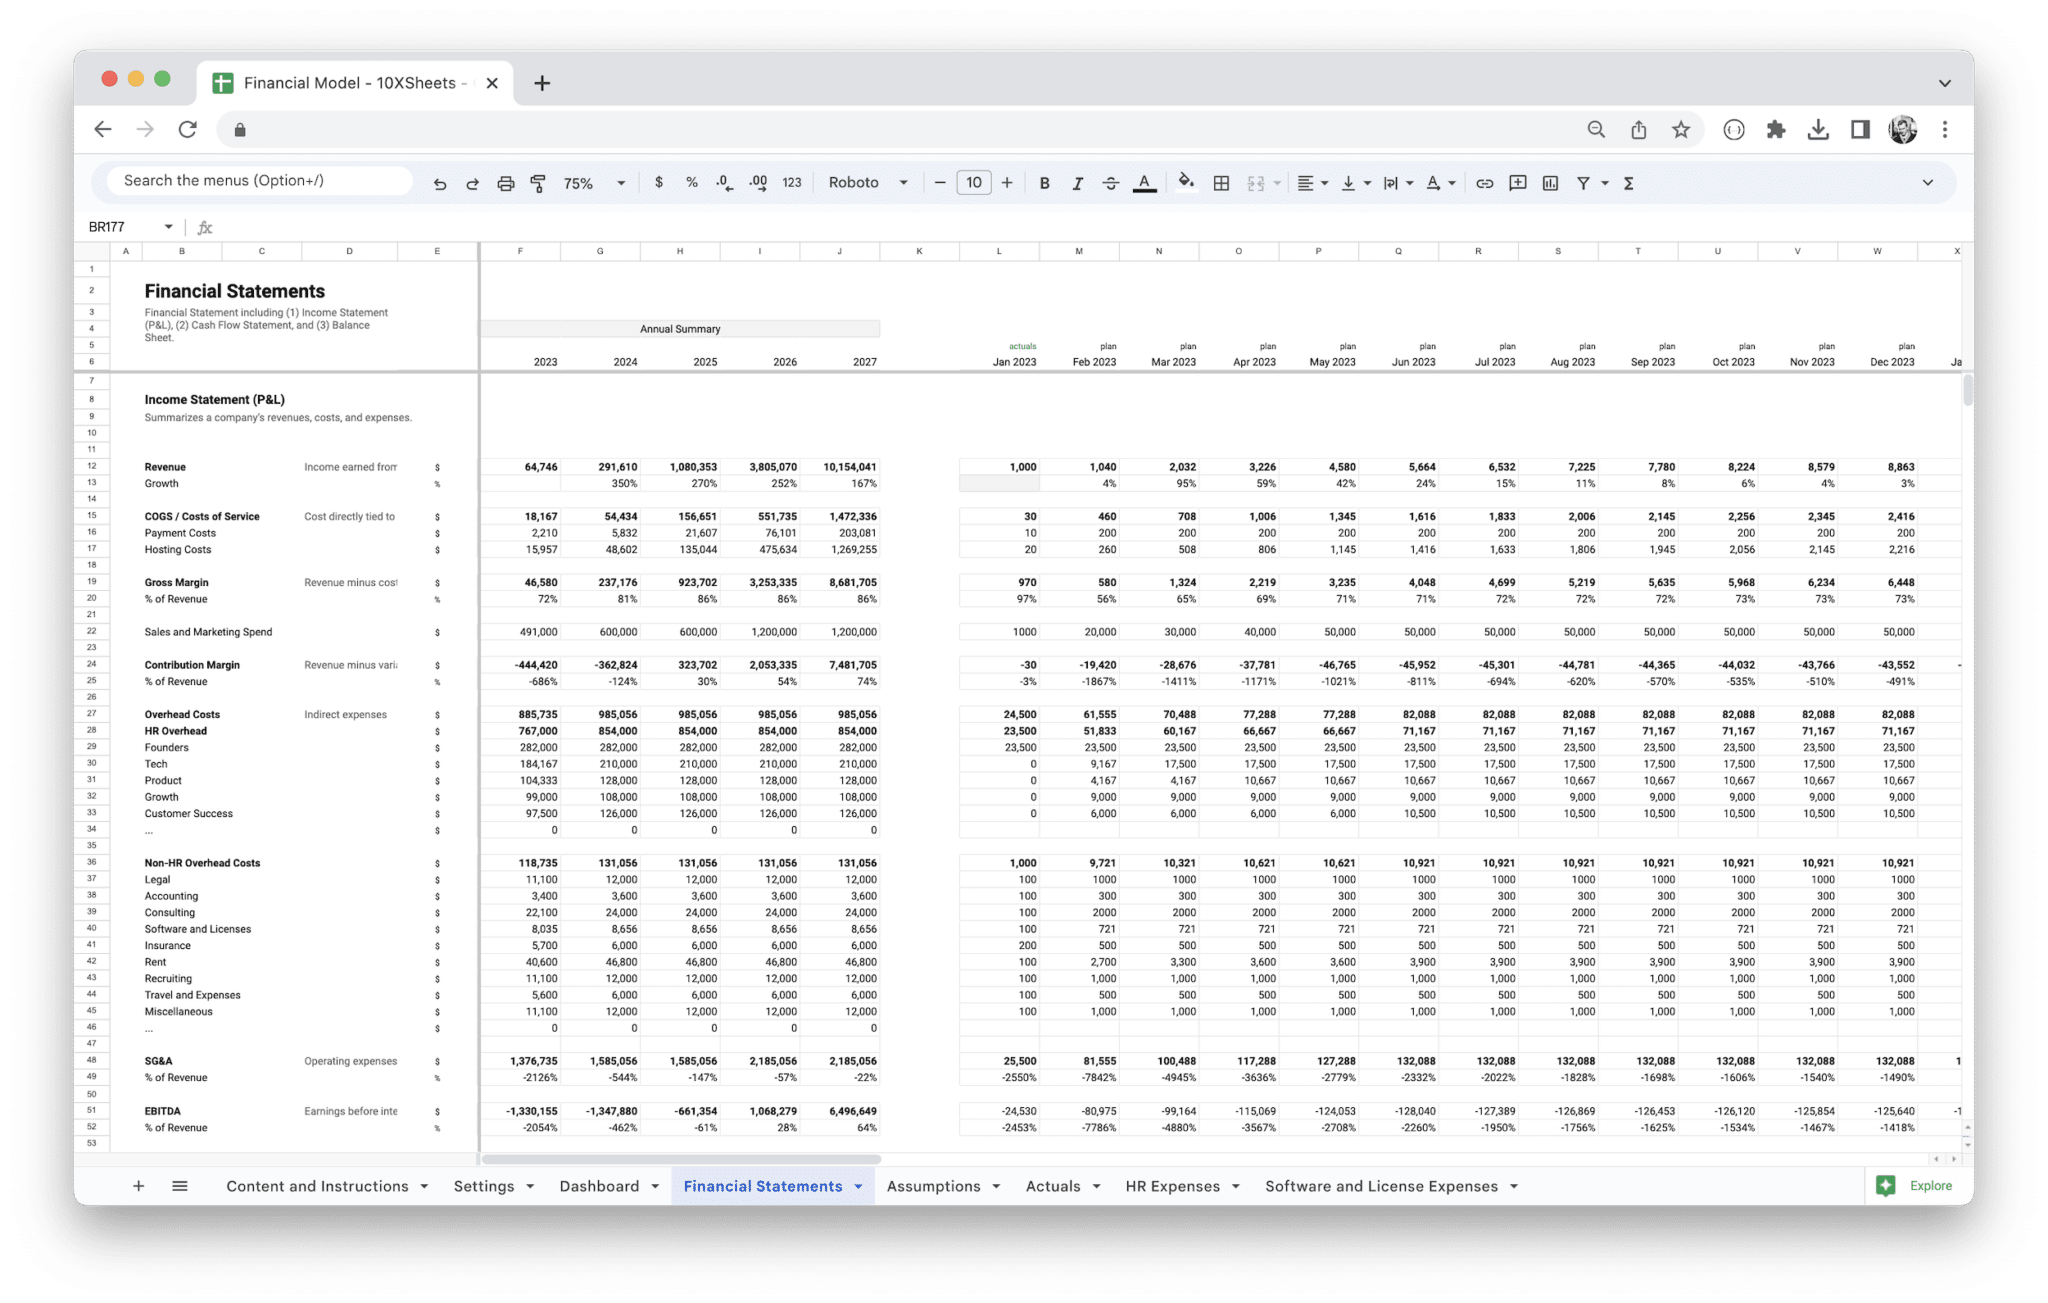
Income Statement Overview
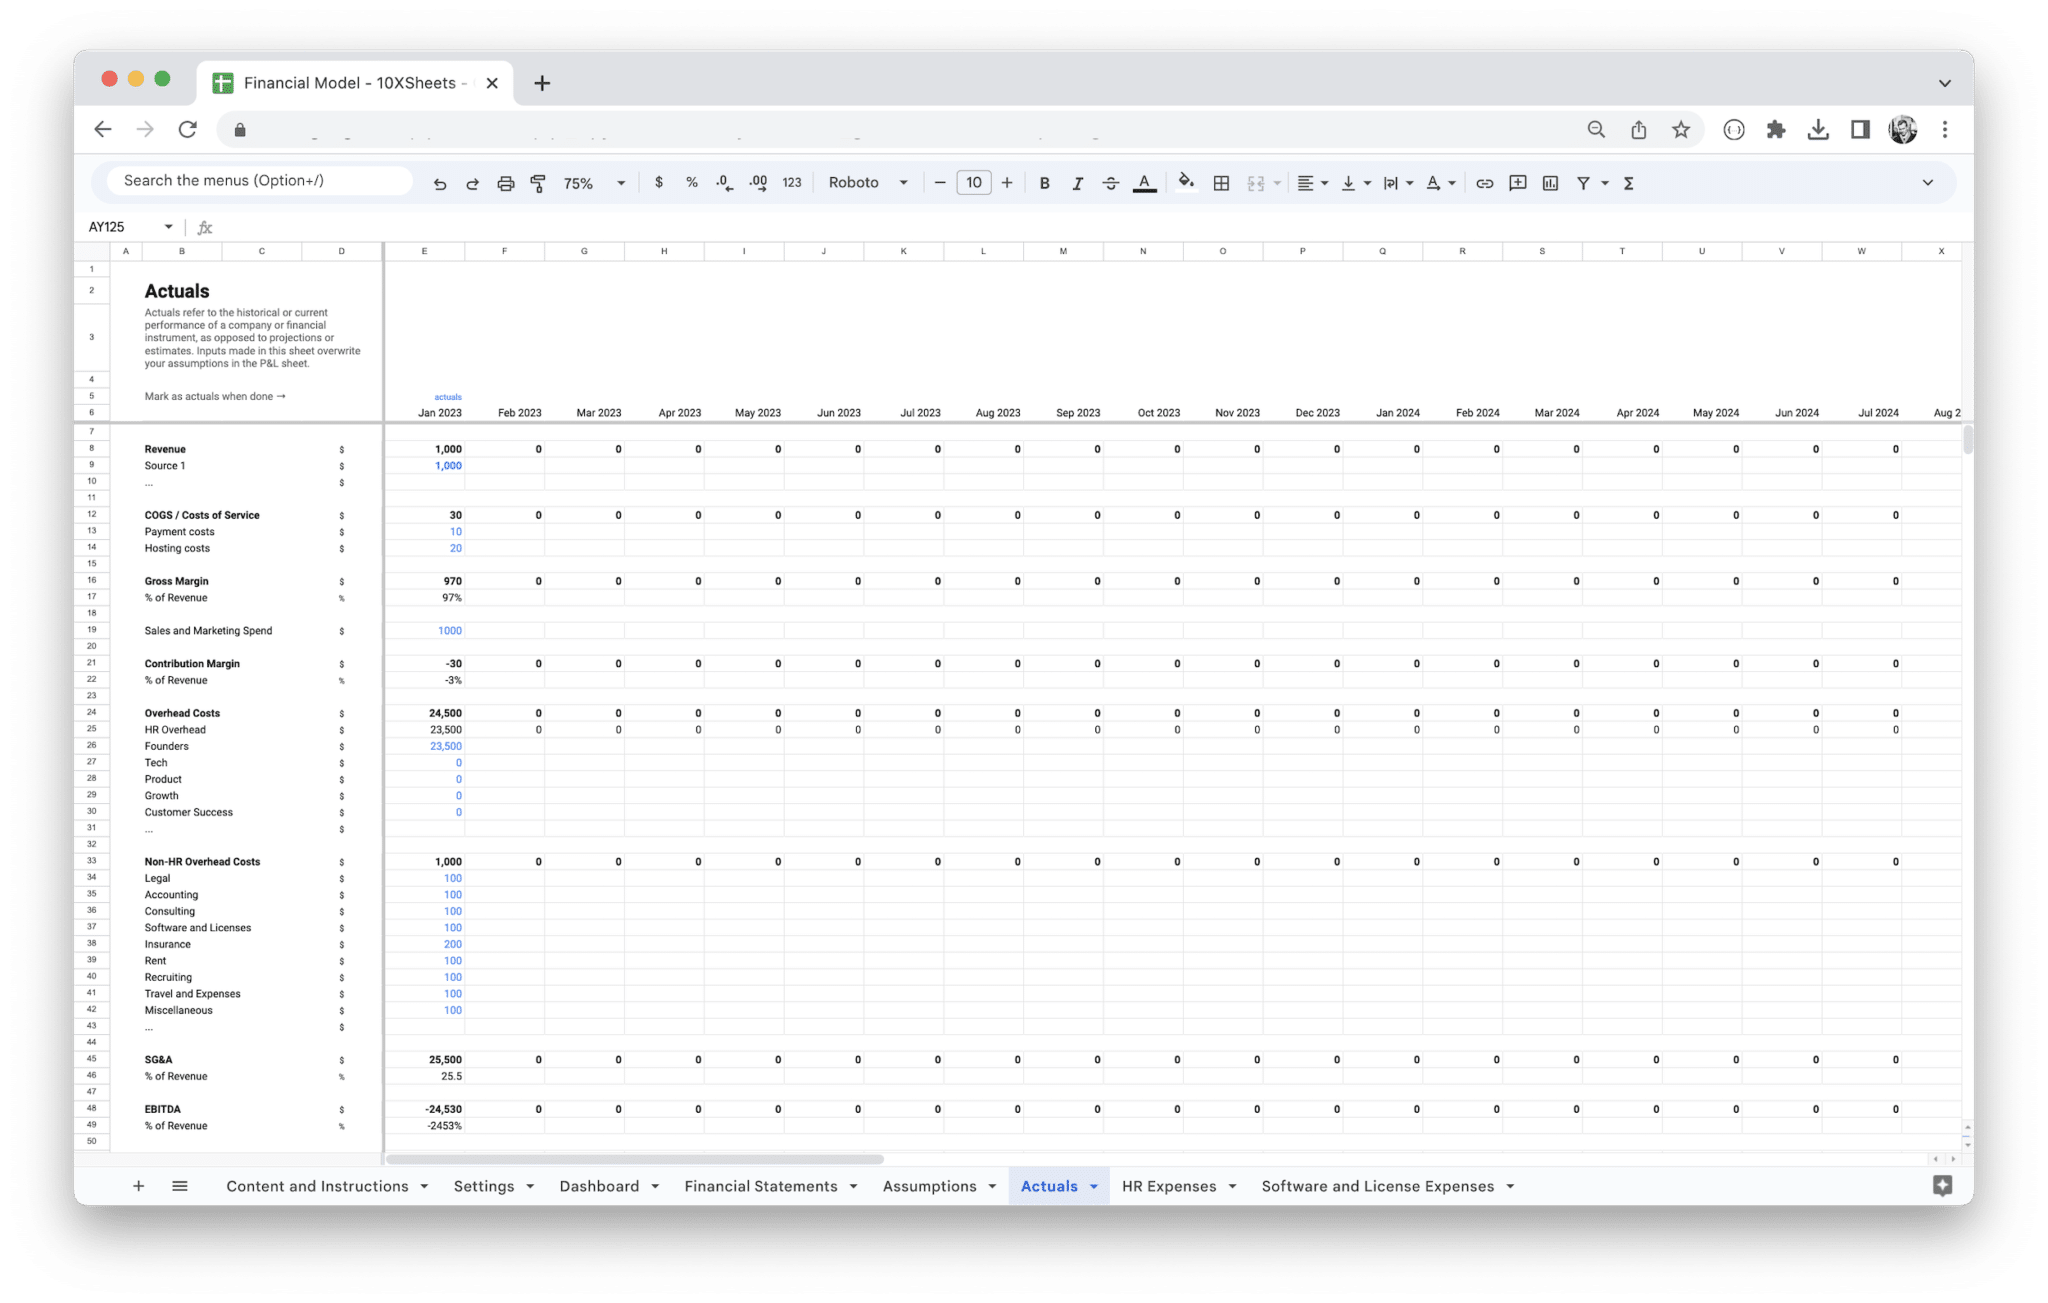
The income statement is a critical element of your financial model as it illustrates your company’s profitability over a given period, typically monthly, quarterly, or annually. This statement offers a snapshot of your business’s revenues, costs, and expenses, ultimately revealing whether your business is making money or losing it. Understanding this will help you assess your operational performance and profitability.
At the top of the income statement is your revenue, which represents the money your business earns from selling goods or services. Revenue generation is the heartbeat of any business, and forecasting it accurately is crucial. For example, if your business relies on subscriptions, your revenue forecast may be based on customer acquisition and retention rates. If your business operates on product sales, you’ll need to factor in seasonal trends and customer demand fluctuations.
Next comes cost of goods sold (COGS), which includes all the direct expenses tied to the production of your products or services. These expenses can include raw materials, labor costs, and manufacturing costs. Subtracting COGS from revenue gives you your gross profit. This is a key metric because it shows how efficiently your company is producing its goods and services.
Operating expenses, such as rent, salaries, marketing, and utilities, come next. These costs are necessary to run your business, but they aren’t directly tied to the production of goods and services. These expenses are subtracted from your gross profit to determine your operating income or EBIT (Earnings Before Interest and Taxes).
Finally, you subtract any interest payments and taxes to arrive at your net income, also known as the “bottom line.” This is the amount of money your company retains after all expenses have been deducted. Net income is a vital figure for investors, as it reflects the overall profitability of the business.
Accurately forecasting your income statement allows you to anticipate profitability and evaluate how changes in pricing, costs, or volume can affect your financial position.
Balance Sheet Breakdown
The balance sheet offers a snapshot of your company’s financial position at a specific point in time. It helps you understand what your business owns (assets), what it owes (liabilities), and the residual interest (equity) that belongs to the owners. The balance sheet is called a “balance” sheet because the total value of assets always equals the total of liabilities plus equity.
Assets are everything the company owns and can be divided into current assets and non-current (or long-term) assets. Current assets are expected to be used up or converted into cash within one year and include cash, accounts receivable, and inventory. Non-current assets, on the other hand, include items like property, plant, and equipment, which are expected to be used for more than a year. These assets provide the foundation for long-term growth.
Liabilities represent what the company owes to others. Just like assets, liabilities are divided into current and non-current categories. Current liabilities are debts or obligations that must be settled within one year, such as accounts payable, short-term loans, and accrued expenses. Non-current liabilities are long-term obligations, such as long-term debt or pension liabilities, that are due beyond the one-year mark.
The difference between assets and liabilities is known as equity, which represents the ownership value in the company. This is calculated as the residual value of assets after all liabilities have been paid. Equity can come from the initial investment by owners or shareholders, retained earnings, or other forms of ownership interests in the business.
The balance sheet is particularly useful for understanding your company’s liquidity, solvency, and capital structure. By reviewing this statement, you can assess whether the company has enough assets to cover its liabilities, and how much leverage it is using to finance its operations.
Cash Flow Statement Fundamentals
The cash flow statement tracks the flow of cash in and out of your business. Unlike the income statement, which uses accrual accounting, the cash flow statement is focused on actual cash movements. This is a crucial element of any financial model because it shows whether your company is generating enough cash to sustain its operations, invest in growth, and meet its obligations.
The statement is typically divided into three sections: operating activities, investing activities, and financing activities.
Operating activities represent the core cash flows related to running your business. These include receipts from customers, payments to suppliers, salaries to employees, and other operating expenses. The net cash from operating activities tells you whether the business is generating sufficient cash from its day-to-day operations. If this number is negative, it may indicate that the company is struggling to convert sales into cash, which can be a warning sign for future liquidity issues.
Investing activities track cash flows related to buying and selling long-term assets, such as property, equipment, or investments in other businesses. If a business is investing heavily in property or equipment, this could indicate growth and expansion. However, if the cash outflows are significantly higher than inflows, it could also be a sign of over-investment or poor asset management.
Financing activities show the cash flows related to borrowing and repaying debt, issuing equity, or repurchasing stock. This section tells you how the company is financing its operations. If a business is issuing stock or taking out loans, it might be preparing for expansion. On the other hand, repurchasing stock or paying off debt could indicate that the company is in a stable financial position and looking to return value to shareholders.
The cash flow statement is important because it shows how well your company is managing its cash—an essential aspect of staying afloat in the long run. Even profitable companies can fail if they run out of cash, so understanding the nuances of cash flow is critical for any business.
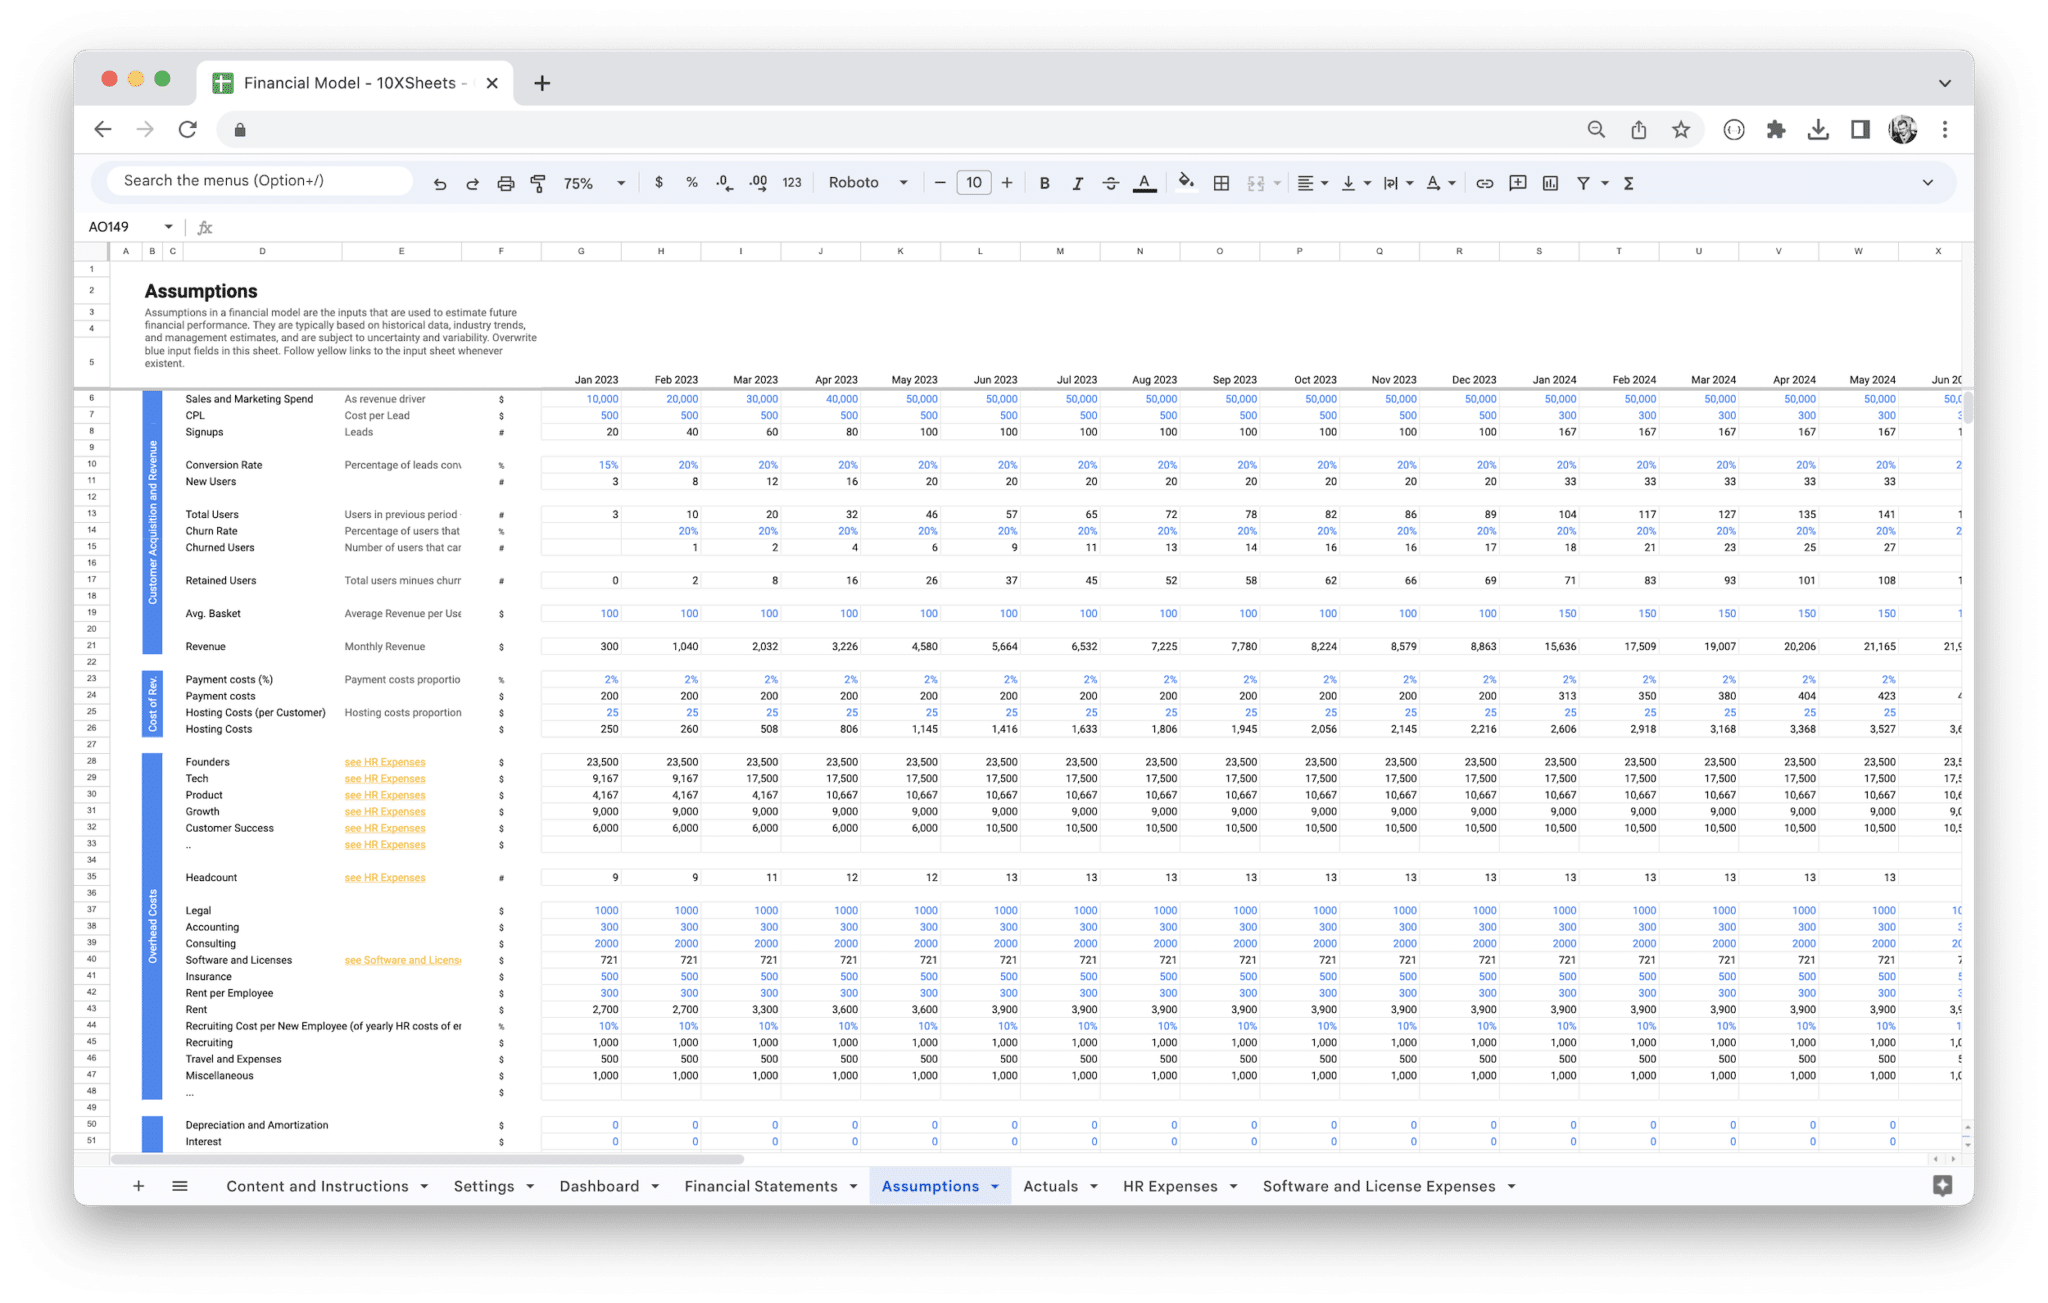
Key Assumptions and Drivers
Financial models are driven by assumptions—inputs that reflect your expectations about future conditions and variables. These assumptions are essential for projecting future financial performance and making strategic decisions. Since many of the key figures in your income statement, balance sheet, and cash flow statement are based on assumptions, it’s important to ensure that your assumptions are both realistic and grounded in data.
Some of the most common assumptions in financial models include:
- Revenue Growth: You’ll typically forecast revenue based on factors such as historical growth rates, market trends, and sales projections. It’s important to consider both short-term fluctuations and long-term trends.
- Cost of Goods Sold (COGS): This will be based on assumptions around raw material costs, labor costs, and production efficiency. For example, if you’re expanding into new markets or scaling up operations, your COGS assumptions might change accordingly.
- Operating Expenses: Assumptions about overhead costs, marketing expenses, and personnel costs are crucial. These assumptions need to be adjusted for inflation, market conditions, and any planned business activities (e.g., new hires or marketing campaigns).
- Capital Expenditures: Assumptions about future investments in fixed assets, such as buildings, machinery, and technology, will affect both the cash flow statement and the balance sheet.
- Financing Assumptions: If your business plans to take on new debt or raise equity, those assumptions will influence both your financing activities and your balance sheet.
Understanding the key drivers behind your business’s financial model allows you to identify what matters most for the success of your company. These drivers are often tied to both external factors (like market trends and economic conditions) and internal factors (such as operational efficiency and cost control). By regularly revisiting and adjusting your assumptions, you can ensure that your financial model remains accurate and reflective of current business conditions.
Each of these components—the income statement, balance sheet, cash flow statement, and assumptions—works together to provide a comprehensive view of your business’s financial health. Understanding how these elements relate to each other is crucial for creating accurate financial projections and making informed business decisions. By regularly reviewing and updating these components, you ensure that your financial model stays relevant and helps guide your company toward growth and stability.
A standard financial model template serves as the backbone for predicting the financial future of a business. By including essential components such as revenue forecasting, expense tracking, and financial ratios, these templates offer a structured approach to building a financial projection. However, the real value of a financial model template lies in its key features that allow for customization, flexibility, and adaptability to the unique needs of any business. Let’s explore these key features and how they enhance the utility of a financial model template.
Customizable Inputs and Assumptions
One of the standout features of a standard financial model template is the ability to customize inputs and assumptions. The template comes with predefined formulas and structures, but the inputs are adjustable, making the model highly adaptable to various business types, industries, and economic conditions. These assumptions serve as the foundation for the entire financial forecast, meaning that getting them right is critical for the model’s accuracy.
For instance, in most financial models, assumptions will include projected sales growth, cost of goods sold (COGS), operating expenses, inflation rates, tax rates, and market conditions. These factors vary widely between businesses, and the flexibility to modify them allows you to tailor the model to reflect your company’s goals and circumstances. If your business is expanding into new markets, you may want to adjust your assumptions to account for market-specific variables such as customer acquisition costs or competitive pricing. Alternatively, if you’re going through a cost-cutting initiative, you can revise your expense assumptions to reflect savings.
By making assumptions customizable, you ensure that the model mirrors the reality of your business. These assumptions can be as simple as annual growth rates or as detailed as variable customer churn rates or unit economics. Additionally, customizing these inputs allows you to simulate different scenarios, helping you prepare for potential risks or opportunities. For example, if you’re unsure of your future sales growth, you can adjust the growth rate assumption to explore the effects of both optimistic and conservative projections. This flexibility enables you to make more informed, strategic decisions.
Revenue Forecasting Models
Revenue forecasting is one of the most critical aspects of any financial model, as it directly impacts the other components, including profitability and cash flow. A solid revenue forecast helps businesses plan for the future, identify potential growth opportunities, and manage expectations. Financial model templates typically come with built-in revenue forecasting models that make the process more streamlined and reliable.
A robust revenue forecasting model will account for various factors that influence revenue, such as pricing strategies, market trends, sales volume, customer acquisition rates, and retention. The most common approach to revenue forecasting is to base it on historical data, applying growth rates to extrapolate future performance. For instance, if a company has experienced a 10% growth in sales year over year, the template can use this historical data to forecast revenue for future periods.
However, revenue forecasting is rarely straightforward. It involves segmenting revenue into different streams, such as product sales, services, subscriptions, or recurring revenue models. A template allows you to forecast each revenue stream separately, providing greater insight into how different aspects of the business will perform in the future. For example, a software-as-a-service (SaaS) business may separate its revenue forecast into subscription revenue, add-ons, and upsells. A detailed forecasting model ensures that you accurately predict revenue across all business segments, even as individual drivers fluctuate over time.
In addition to traditional forecasting methods, a good financial model template should also support dynamic forecasting. For instance, you may want to consider factors like seasonality, market penetration, or economic trends. The template can integrate these variables, ensuring that your forecasts are as realistic as possible. If your business experiences a dip in sales during certain months or quarters, the template can adjust your forecast accordingly, ensuring that you’re not caught off guard by seasonal variations.
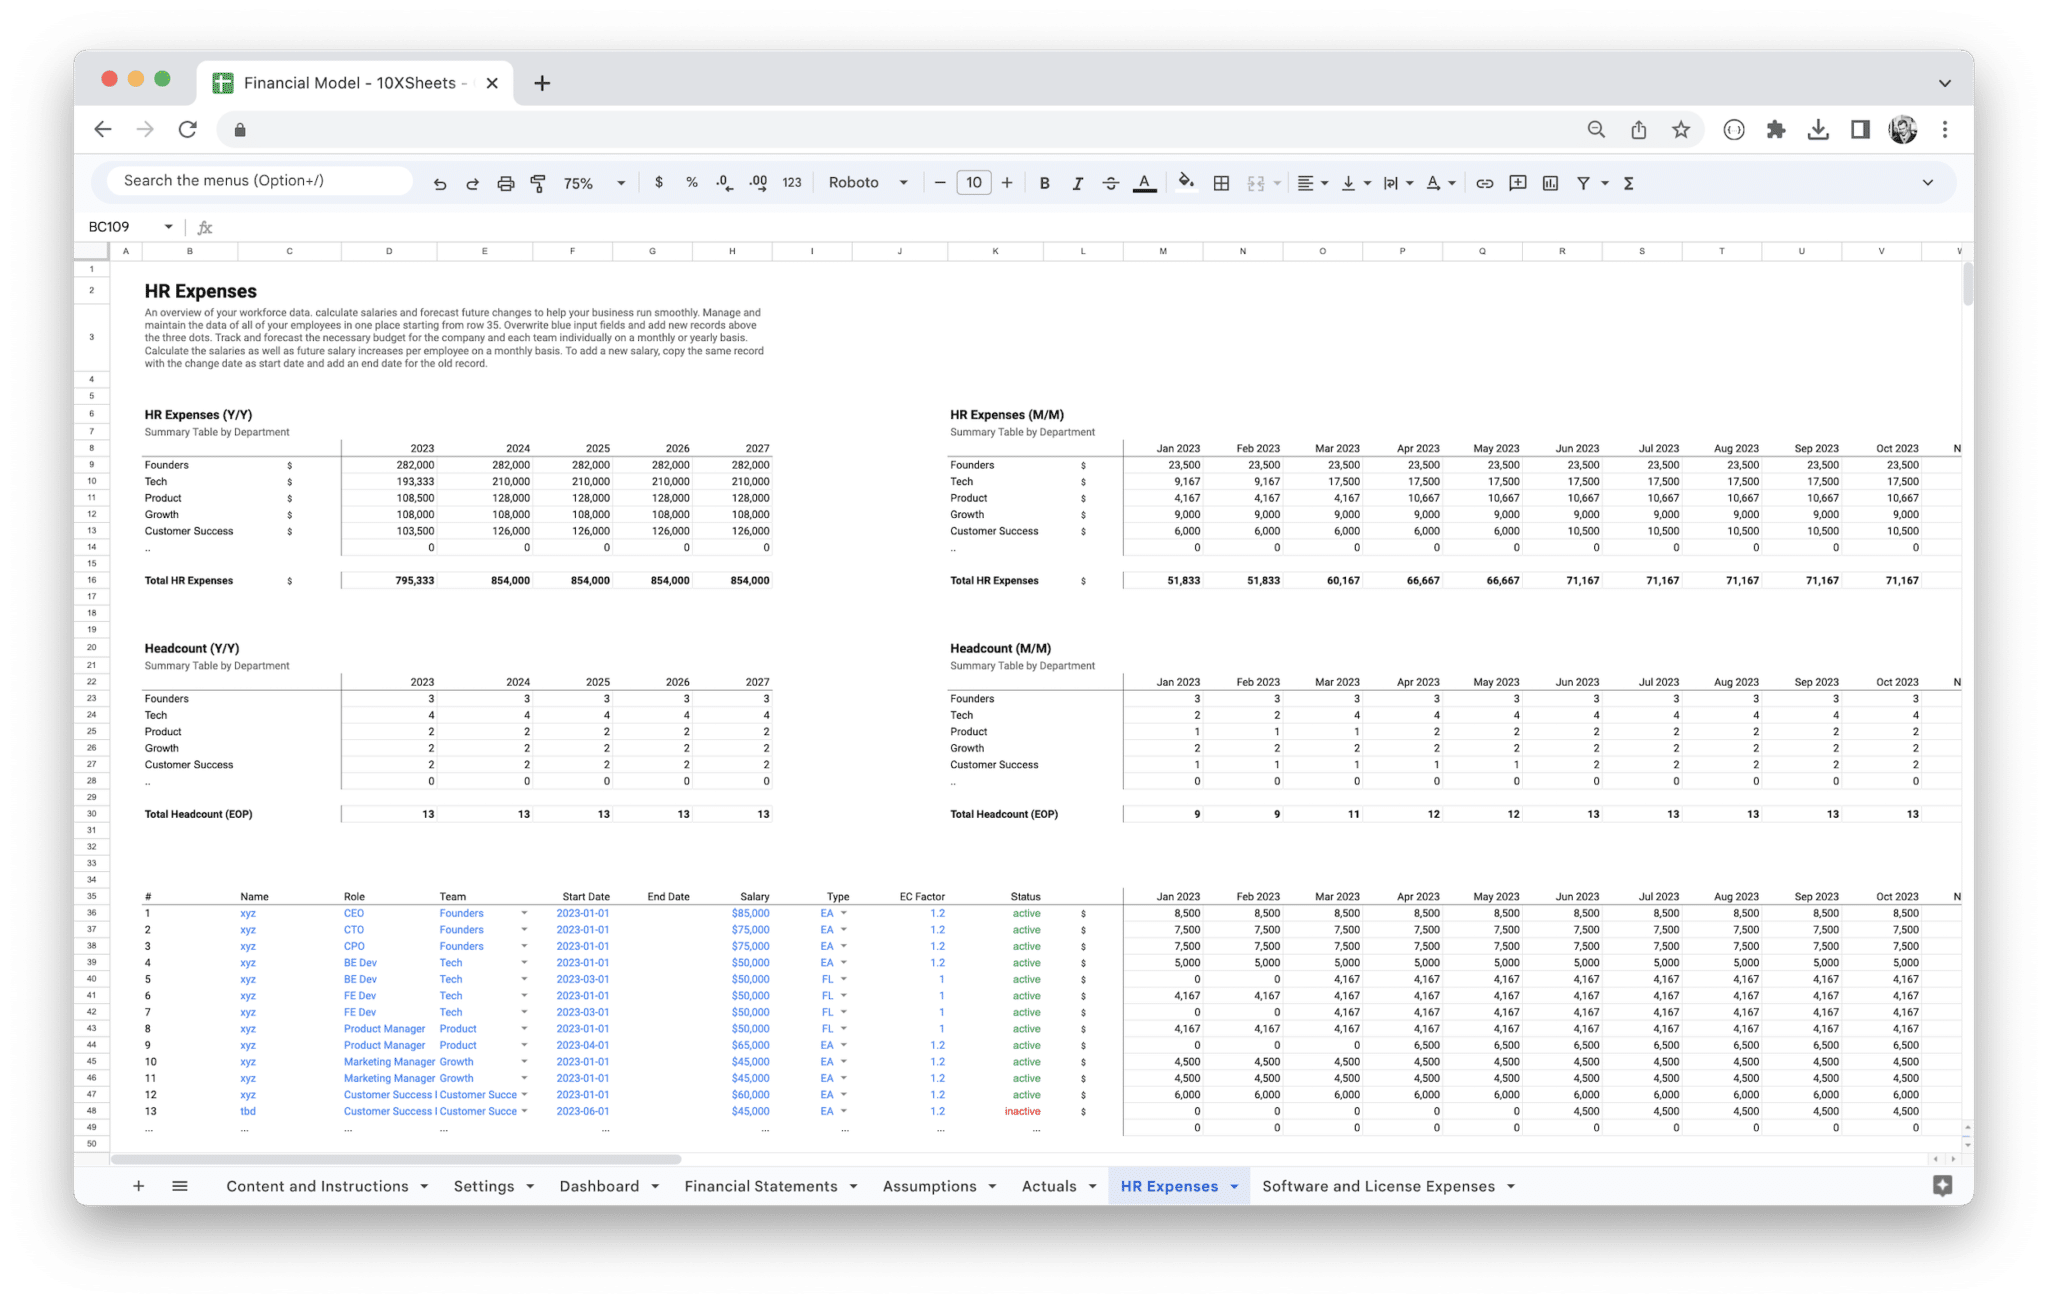
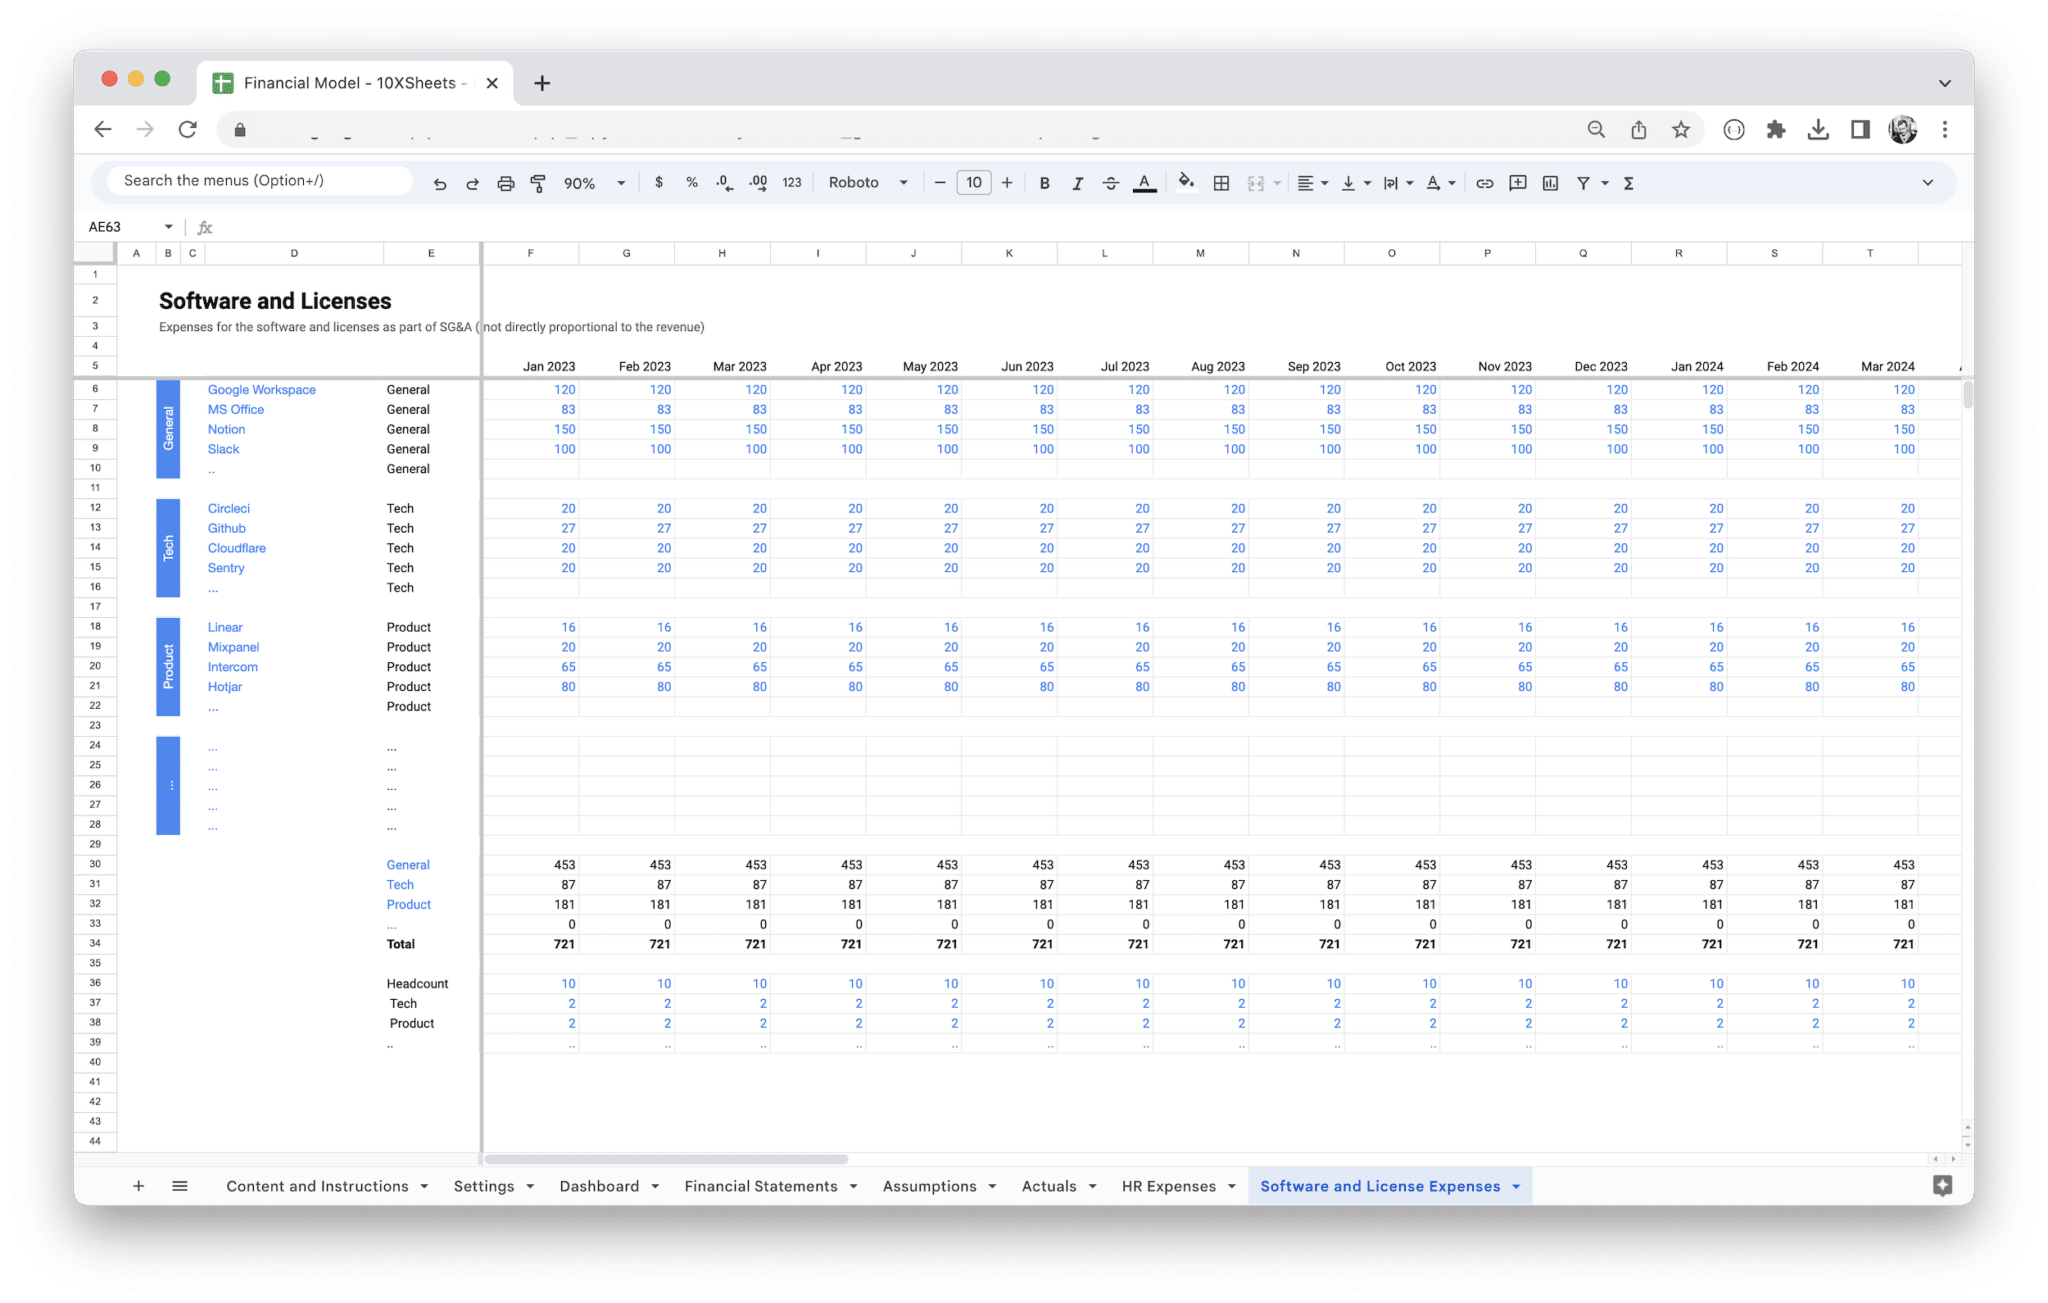
Cost Structure and Expense Tracking
Understanding your cost structure and accurately tracking expenses are critical for building an effective financial model. A financial model template simplifies this process by breaking down costs into different categories and providing an easy way to input and update expense data. Cost management is vital not only for profitability but also for cash flow and budgeting.
Most businesses incur a variety of costs, including fixed costs (e.g., rent, salaries) and variable costs (e.g., raw materials, utilities). A financial model template helps track both types of costs separately, offering insight into how each category impacts the bottom line. Fixed costs remain relatively constant regardless of production or sales volume, while variable costs change in response to business activity. Being able to differentiate between the two helps you understand the scalability of your business and predict how expenses will evolve as you grow.
For example, let’s say you’re operating a manufacturing company. Your fixed costs could include salaries for administrative staff, rent for the factory, and equipment depreciation. On the other hand, your variable costs would include raw materials, production labor, and shipping expenses. A financial model template will allow you to input and track these costs in their appropriate categories, making it easier to analyze your profit margins and identify areas where you can optimize operations.
Expense tracking is also important for budgeting and financial planning. Templates often include expense forecasting tools that let you predict future costs based on historical data or projected growth. For example, if you know that your labor costs increase by 5% annually, you can input this assumption into the model, and it will automatically adjust future expense projections. By tracking expenses closely and understanding their relationship to revenue, you gain valuable insights into areas for improvement, such as cutting unnecessary costs or increasing efficiency in certain areas.
In addition to providing a clear picture of your costs, financial model templates often include tools for scenario analysis, allowing you to simulate how different cost structures will impact your financial outlook. For example, you can input different assumptions regarding labor costs, material prices, or overheads, then analyze how these changes affect your profitability and cash flow. This level of detail enables you to make proactive adjustments to your cost structure before problems arise, helping you keep your business on track financially.
Financial Projections and Ratios
Financial projections and ratios are indispensable for evaluating the future performance of a business. These projections offer insights into profitability, growth potential, and financial health, while financial ratios provide key performance indicators (KPIs) that measure efficiency and effectiveness in different areas of your business. A high-quality financial model template will include sections for projecting key financial figures, such as profits, cash flows, and return on investment, as well as automatically calculating important ratios.
Projections in a financial model are built based on your inputs, assumptions, and historical data. These projections typically include forecasts for the income statement (revenues, expenses, and net income), balance sheet (assets, liabilities, and equity), and cash flow statement (operating, investing, and financing activities). The projections provide a detailed picture of what your company’s financial future could look like under different scenarios. For example, based on your revenue assumptions, the template might project your income, expenses, and net income for the next five years, allowing you to see potential profit margins and cash flow patterns.
Financial ratios, on the other hand, allow you to assess the health of your business in a more granular way. Common financial ratios included in financial models are:
- Gross Profit Margin: Measures how much money your company makes from its core activities after deducting the cost of goods sold. It helps you evaluate the efficiency of your production processes.
- Net Profit Margin: This ratio shows how much profit you make for each dollar of revenue after all expenses, taxes, and interest are deducted.
- Return on Assets (ROA): Indicates how effectively your company is using its assets to generate profit.
- Current Ratio: Assesses your company’s ability to meet short-term obligations by comparing current assets to current liabilities.
- Debt-to-Equity Ratio: Helps assess the financial leverage of the company by comparing its total debt to shareholders’ equity.
By including these ratios, a financial model template helps you evaluate whether your business is on track to meet its financial goals. For instance, if your gross profit margin is shrinking, this might signal inefficiencies in production or rising costs. Alternatively, if your debt-to-equity ratio is too high, it could indicate that your company is over-leveraged and may face financial difficulties in the future.
Having these projections and ratios readily available allows you to make proactive adjustments to your business strategy. Whether you need to focus on improving profitability, reducing debt, or optimizing cash flow, the projections and ratios guide you toward the right decisions. Furthermore, they help you present a clearer picture to stakeholders, such as investors, lenders, and board members, by showcasing the business’s potential and financial stability.
Each of these key features—customizable inputs, revenue forecasting, cost tracking, and financial projections/ratios—ensures that your financial model is not only a static document but a dynamic tool that adapts to changes in your business environment. By understanding and leveraging these features, you can create a financial model that provides real-time insights, helping you navigate your business through both stable and uncertain times.
Building a financial model from scratch can be intimidating at first, but once you break it down into manageable steps, it becomes a highly rewarding task. A custom financial model is a powerful tool that helps you analyze business performance, make informed decisions, and forecast future financial outcomes. Whether you are an entrepreneur, financial analyst, or business manager, mastering the process of creating your own standard financial model template will give you a competitive edge.
Let’s dive into the essential steps for building your own template, from laying the groundwork to choosing the right software and structuring your sheets. By the end of this process, you’ll be equipped to create a model that’s tailored to your business’s specific needs and capable of offering invaluable insights.
How to Build a Financial Model Template?
The process of building a financial model can be broken down into several stages, each building on the previous one. It’s a good idea to start with a simple framework and gradually add complexity as you become more comfortable with the process. Here’s a step-by-step guide to help you get started:
- Define the Purpose of Your Model: Every financial model serves a specific purpose. Before you begin, ask yourself what you want to achieve with the model. Are you preparing for investment? Do you need to evaluate your company’s financial health or create a budget? The purpose of the model will determine the structure and type of assumptions you need to make.
- Gather Historical Data: A reliable financial model begins with a solid foundation of historical data. This includes past income statements, balance sheets, and cash flow statements. Collect at least three to five years of data, if available, to provide a clear picture of your business’s financial trends. Use this data as a base for making assumptions about future performance.
- Identify Key Assumptions: Assumptions form the foundation of your model. They might include sales growth, pricing strategies, variable costs, fixed costs, and capital expenditure plans. These assumptions will drive the future projections in your model. Be sure to base your assumptions on realistic data, market research, or industry benchmarks, as inaccurate assumptions can lead to flawed results.
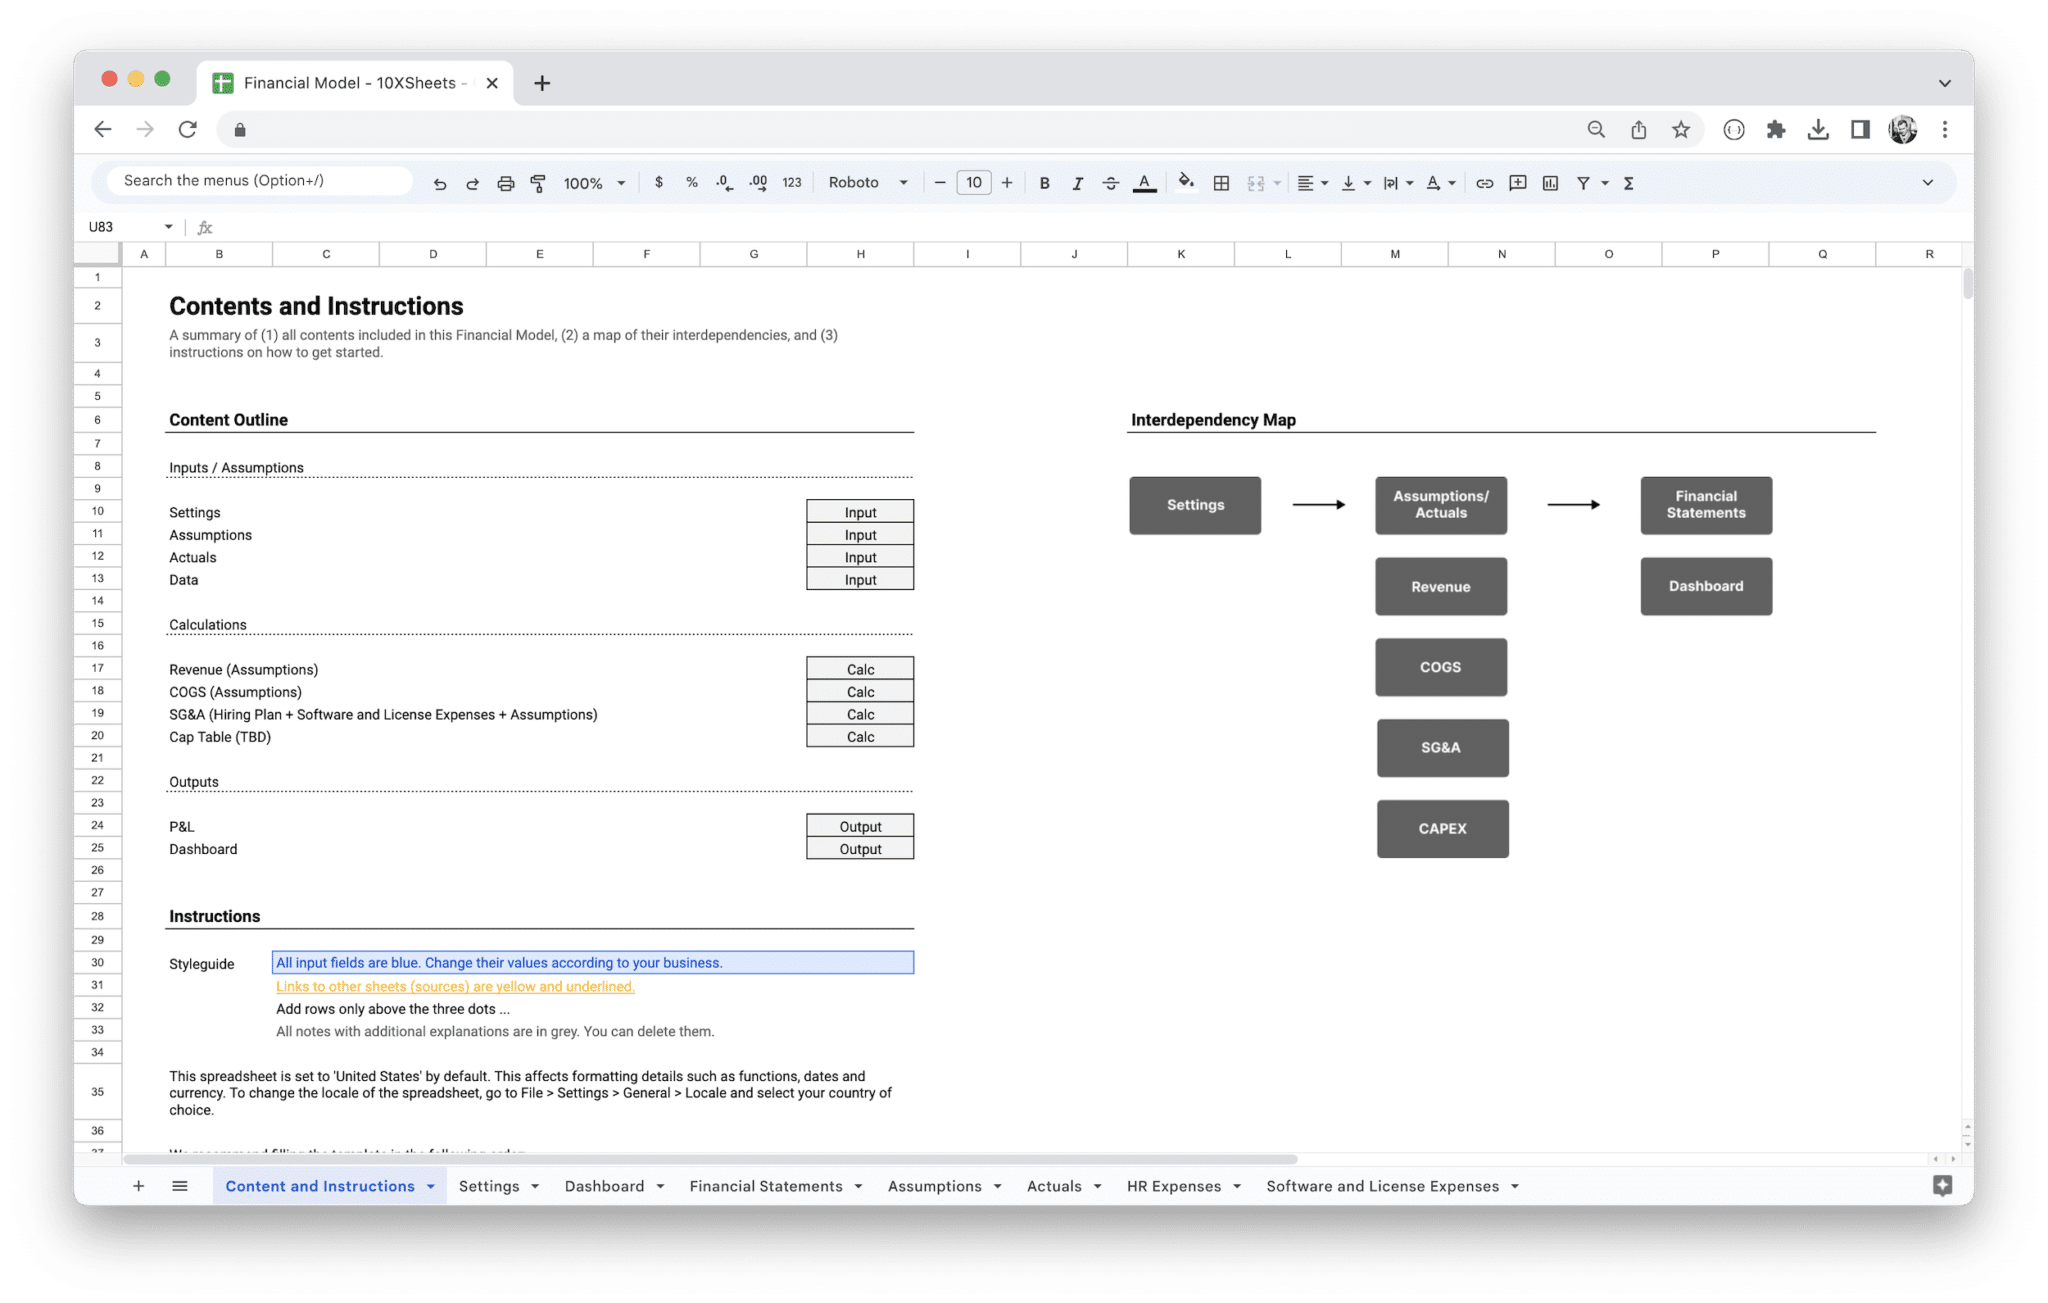
- Build the Structure of Your Model: Start by creating the basic structure of your financial model, which will include separate sheets or sections for:
- Inputs and Assumptions: This is where you will store all the data you use to drive the model.
- Income Statement: A projection of revenues, costs, and profits.
- Balance Sheet: A snapshot of assets, liabilities, and equity.
- Cash Flow Statement: A report of how cash is expected to flow into and out of the business.
Once you’ve set up these key sections, you can start linking them together with formulas that connect assumptions to projected outcomes.
- Input Data and Forecasts: Now that you have the structure in place, start inputting data into the model. Begin with historical numbers to ensure that the model reflects accurate past performance. Then, using your assumptions, forecast future revenue, costs, and profits. For example, you might project revenue based on growth rates, or expenses based on inflation or scaling operations. The further out you project, the more important it becomes to account for uncertainties and changing conditions.
- Link Financial Statements: The next step is to ensure that your financial statements are interlinked. Changes in one part of the model—such as an increase in sales or a rise in expenses—should automatically reflect across the other sections. For example, increased revenue will affect your cash flow and balance sheet. Similarly, any depreciation or capital expenditures should update both the income statement and the balance sheet.
- Validate and Refine the Model: After inputting your data and linking the sheets, you should test the model. Start by performing sensitivity analysis to understand how changes in key variables affect the overall financial picture. For example, you might vary the sales growth rate or change the assumptions for cost inflation to see how these shifts impact profitability. This step is crucial to ensure that your model is robust and that you understand the relationships between different assumptions and outcomes.
- Review and Interpret Results: Once you’ve built the model, it’s time to analyze the results. Look for trends in your financial projections, such as profitability, liquidity, and cash flow. Check your financial ratios (such as ROI, gross margin, and current ratio) to ensure that the business is on a healthy financial trajectory. If the results aren’t what you expected, revisit your assumptions to see where adjustments need to be made.
By following these steps, you can build a financial model that provides a detailed and actionable forecast for your business.
Choosing the Right Software (Excel, Google Sheets)
Choosing the right software for building and maintaining your financial model is crucial for efficiency and flexibility. Both Excel and Google Sheets are commonly used tools for financial modeling, and each has its own set of advantages.
Excel: The Industry Standard
Excel is the most widely used tool for financial modeling, especially in more complex models. It offers advanced features like pivot tables, complex formulas, data visualization tools, and compatibility with various third-party financial plugins. Excel is ideal if you need to work with large data sets or require advanced analytics, such as scenario analysis or Monte Carlo simulations. It also allows for easier integration with external databases, which is particularly helpful for large businesses or companies with multiple revenue streams.
However, Excel does come with a steeper learning curve and may require a higher level of expertise to fully leverage its potential. It is also a desktop-based tool, which means you can’t collaborate in real-time unless you are using specific sharing options.
Google Sheets: Collaboration and Accessibility
Google Sheets is an excellent alternative for businesses looking for a more accessible and collaborative tool. Google Sheets offers many of the same core features as Excel, such as formulas, charts, and data validation, but it also allows for real-time collaboration, making it easy for multiple team members to work on the model simultaneously. Additionally, Google Sheets is cloud-based, which means you can access your model from anywhere with an internet connection, which can be a huge benefit for businesses with remote teams or those that need to share their models with investors and stakeholders.
While Google Sheets is a more user-friendly tool, it may not have the same depth of advanced features as Excel. For basic financial models, however, it’s more than adequate, and its integration with other Google Workspace tools (such as Google Forms or Google Data Studio) can enhance its functionality.
Ultimately, the choice between Excel and Google Sheets will depend on the complexity of your model and your need for collaboration. For most businesses, starting with Google Sheets may be enough, while larger, more complex models might benefit from the advanced capabilities of Excel.
Structuring Sheets for Maximum Efficiency
Once you’ve selected your software, structuring your sheets effectively is crucial for ensuring that your model is easy to navigate and update. A well-organized model will save you time, reduce errors, and make it easier for others to understand your assumptions and projections. Here’s how you can structure your sheets for maximum efficiency:
- Inputs Sheet: Start with an “Inputs” or “Assumptions” sheet where you store all the key assumptions for your model. This should include variables like sales growth rates, tax rates, expense assumptions, and any other inputs that drive the model. By placing all your assumptions in one place, you can easily modify them later and see how they affect the overall model.
- Income Statement Sheet: Create a separate sheet for the income statement, which should include revenue projections, COGS, operating expenses, and net income. Use Excel or Google Sheets’ formulas to link these numbers back to the assumptions sheet, so that changes in assumptions automatically update the income statement.
- Balance Sheet and Cash Flow Sheets: Similarly, set up separate sheets for your balance sheet and cash flow statement. Both of these should include forecasts for assets, liabilities, equity, and cash movements, based on the assumptions and inputs. Ensure that the balance sheet balances (i.e., assets = liabilities + equity) and that your cash flow statement reconciles with the net changes in cash from the income statement and balance sheet.
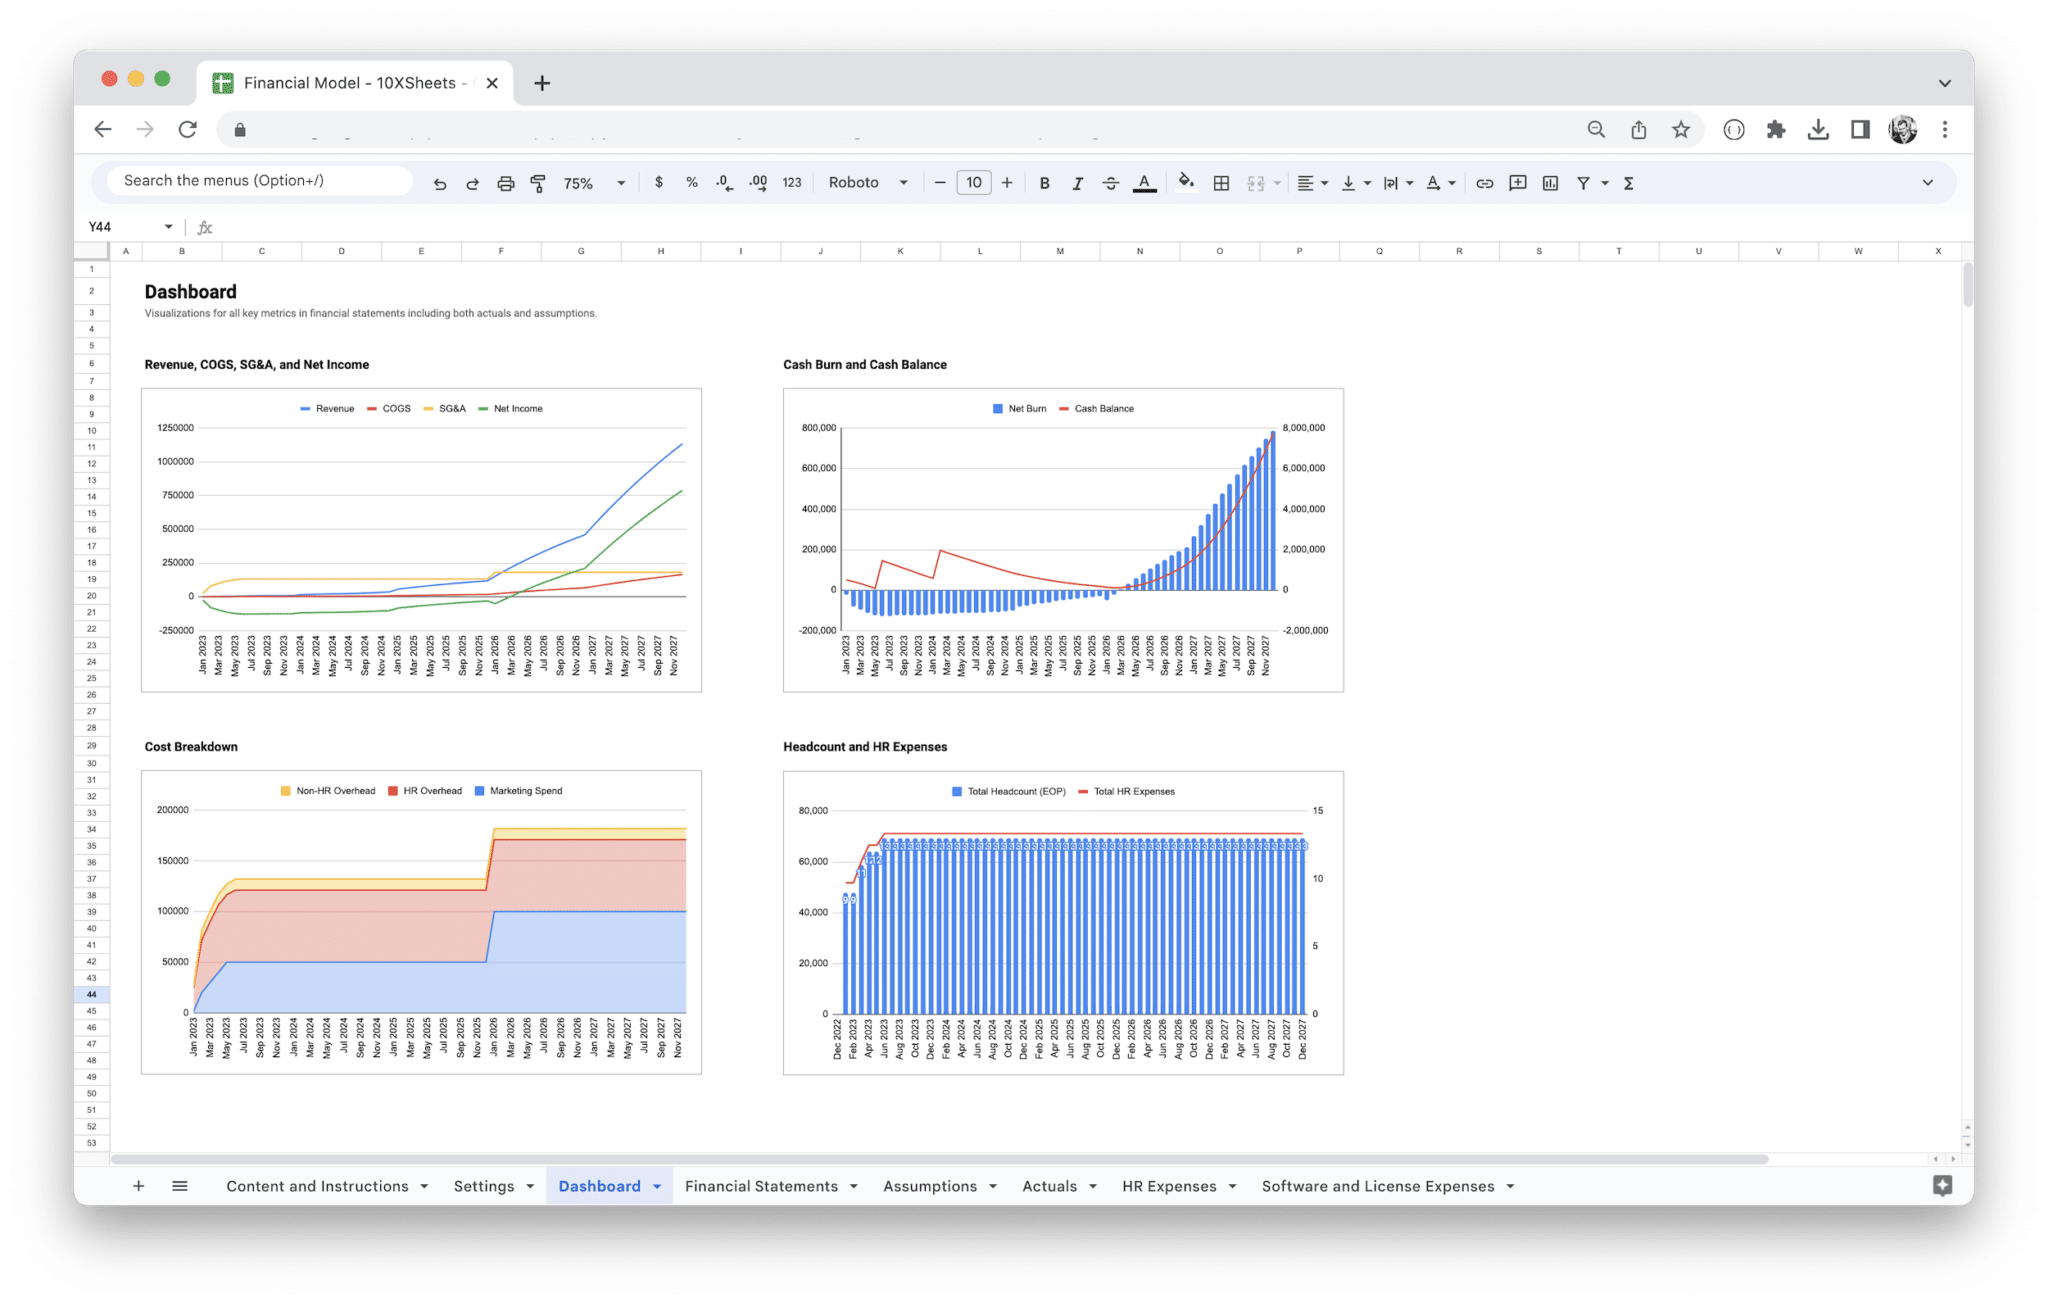
- Summary or Dashboard Sheet: A summary sheet or dashboard should be used to provide an overview of the most important metrics, such as projected profit, cash flow, and financial ratios. This will allow you to quickly assess the key takeaways from your model without having to dig through each individual sheet.
- Scenario Analysis Sheet: Consider adding a scenario analysis sheet that allows you to test different assumptions and see how they affect your financial projections. This might include best-case, worst-case, and most likely scenarios to provide a range of potential outcomes.
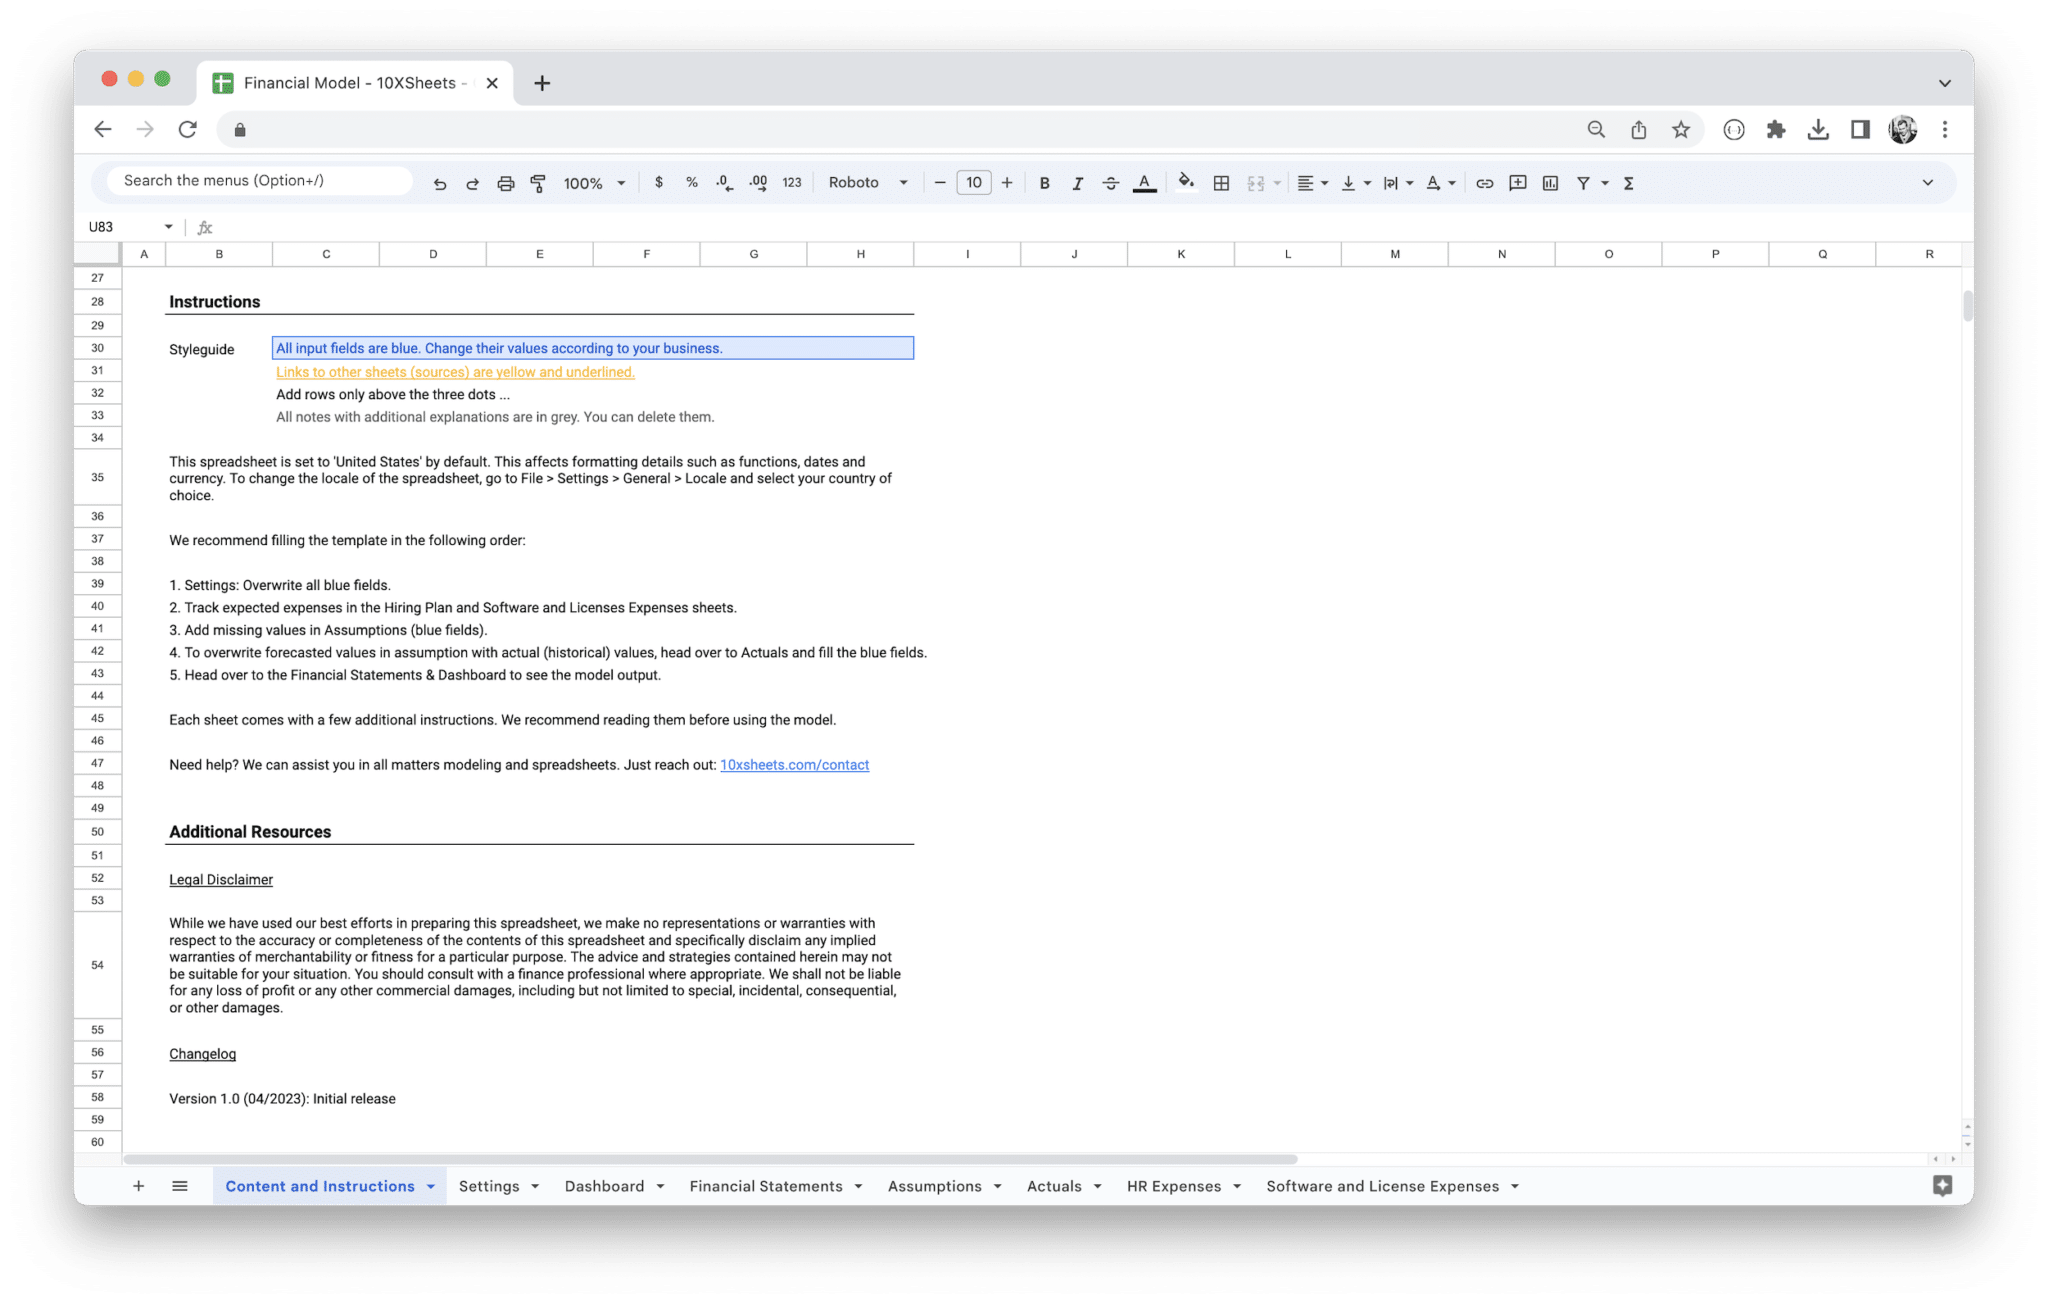
Best Practices for Inputting Financial Data
Inputting data into your financial model is an art as much as it is a science. Accurate data is the backbone of any financial model, but there are a few best practices that can help you ensure that your model is reliable, easy to update, and scalable.
- Use Consistent Units: Always use consistent units of measurement. If you’re working with revenue, for example, ensure that you’re using the same time frame (e.g., monthly or yearly) and currency throughout the entire model. Mixing up units can cause confusion and errors.
- Avoid Hard-Coding Numbers: Wherever possible, avoid hard-coding values into your model. Instead, link your assumptions to other sections of the model so that any changes in assumptions automatically update all relevant outputs. This will make it easier to update your model in the future and ensure that you don’t accidentally miss changes in one part of the model.
- Validate Your Data: Double-check all your data and assumptions. For instance, make sure that your revenue projections are based on realistic assumptions (such as historical growth rates or market research) and that your cost assumptions align with industry standards. Cross-reference your data with external sources, if necessary, to ensure accuracy.
- Document Your Assumptions: Always provide clear documentation for the assumptions you’re using in your model. This will not only make the model more understandable to others but will also help you track changes over time. You can include comments within the spreadsheet or create a dedicated assumptions section at the beginning of your model.
By following these best practices, you’ll build a financial model that’s not only accurate but also flexible, allowing you to make adjustments and updates as your business evolves.
Building your own standard financial model template requires attention to detail, but with the right steps and structure, you can create a tool that provides actionable insights into your business’s financial future. By choosing the right software, organizing your sheets effectively, and adhering to best practices for inputting data, you’ll be on your way to creating a financial model that supports smarter decision-making and long-term success.
A well-built financial model template is a versatile tool that can be applied across various aspects of business management, from valuations and investment analysis to forecasting and performance evaluation. Whether you’re preparing for an investment round, creating a detailed budget, evaluating different scenarios, or analyzing your company’s financial health, a standard financial model template is an indispensable asset. These templates not only provide clarity on your financial situation but also offer strategic insights that guide your decisions.
Let’s dive into some of the most common use cases for financial models, each designed to provide a unique perspective on your business’s financial outlook.
Business Valuation and Investment Analysis
One of the primary uses of a financial model is for business valuation and investment analysis. Whether you’re looking to sell your business, raise capital, or attract potential investors, a financial model can help you determine the fair value of your business and provide key insights into its potential growth. Investors and buyers often require a detailed financial model to understand how your company generates revenue, manages costs, and forecasts future growth.
To perform a business valuation, financial models typically include discounted cash flow (DCF) analysis, comparable company analysis, and precedent transaction analysis. Each of these valuation methods provides a different approach to estimating the business’s worth. For example, a DCF analysis projects the company’s future cash flows and then discounts them to the present value, taking into account the time value of money. This method is particularly valuable for businesses with stable and predictable cash flows.
Financial model templates designed for business valuations also help you assess financial ratios such as price-to-earnings (P/E) or enterprise value-to-EBITDA (EV/EBITDA), which can provide quick insights into how your company compares to similar businesses in the industry. Investors use these ratios to evaluate whether your business is undervalued or overvalued compared to its peers, guiding investment decisions.
Additionally, when preparing for an investment round, a financial model can demonstrate the expected return on investment (ROI) and the potential exit strategies. Whether it’s an equity stake or a loan, investors want to know when they’ll see a return and what their financial risk is. The model’s projections for revenue, expenses, profits, and cash flow provide critical insight into the company’s growth potential, helping to solidify its valuation.
For example, imagine you’re seeking venture capital for a tech startup. Your financial model would forecast revenue based on customer acquisition, expected churn, and pricing strategies. By applying valuation techniques like DCF, potential investors can assess whether your projected growth is likely to deliver the returns they’re seeking.
Budgeting and Forecasting
Budgeting and forecasting are essential activities that every business must engage in to plan for future operations, align teams, and ensure financial stability. A financial model template is a powerful tool for both activities, providing a structured, data-driven way to project future financial performance. By leveraging historical data and key assumptions, businesses can build realistic budgets and forecasts that help them manage cash flow, plan for expansion, and set financial goals.
In budgeting, financial models help businesses set realistic expense targets and revenue expectations. With accurate forecasting, you can ensure that your budget aligns with your company’s growth plans, operational needs, and financial constraints. This can include everything from projecting operating expenses, such as marketing and personnel costs, to capital expenditures (CapEx), like new equipment or facility expansion.
Financial models for budgeting typically take historical performance data and make adjustments for future growth or cost-saving measures. For instance, if your business is planning to expand into a new market, the model would incorporate estimates for the costs of market entry, including marketing, hiring, and local compliance. By projecting these costs against expected revenue growth, the model ensures that your budget reflects the potential return on investment and ensures sustainable financial management.
In forecasting, the goal is to predict how your business will perform under different conditions over a given period (e.g., monthly, quarterly, or annually). Financial models help create reliable revenue and cash flow projections that serve as a roadmap for the business. For example, if you run a seasonal business, forecasting tools within a financial model template can help you account for fluctuating demand, ensuring that your business is financially prepared for slower months.
A forecasted income statement, balance sheet, and cash flow statement within the model will provide you with a comprehensive view of your company’s financial health, helping you identify potential cash shortfalls, profitability concerns, or areas of overspending before they become critical problems. For instance, if your revenue projections show a shortfall in a key quarter, the model allows you to take corrective action in advance—whether by reducing costs, delaying discretionary spending, or pursuing additional financing.
Moreover, businesses can use financial models to continuously track actual performance against budgeted numbers. By updating your model with actual financial results on a monthly or quarterly basis, you can identify discrepancies early on and make adjustments to your strategy.
Scenario Planning and Sensitivity Analysis
Scenario planning and sensitivity analysis are crucial techniques used by businesses to prepare for uncertainty and assess how different factors might impact their financial future. These tools are built directly into financial model templates, enabling you to simulate various scenarios and adjust your assumptions to see how they affect your overall financial performance.
Scenario planning allows you to model different business environments, taking into account changes in key drivers such as revenue growth, cost structure, or market conditions. For example, you may want to create several scenarios: a “best-case” scenario where your company exceeds expectations, a “worst-case” scenario where growth stalls, and a “base-case” scenario based on conservative assumptions. By modeling these different scenarios, you can better understand the range of possible outcomes and prepare accordingly.
In sensitivity analysis, you test the sensitivity of your financial model to changes in key variables. This involves changing one or more assumptions (such as sales growth, price points, or labor costs) and analyzing the resulting impact on your financial projections. For example, if you’re unsure about the impact of a price increase on customer demand, sensitivity analysis allows you to model different price points and see how they affect your revenue, profitability, and overall financial health. This helps you make data-driven decisions and plan for various outcomes.
A key example of sensitivity analysis is what-if analysis. Let’s say you run a retail business and are considering increasing your marketing spend. You can model what happens to your sales and profit margins if the marketing investment results in a 5%, 10%, or 15% increase in revenue. By running these scenarios, you can determine whether the potential upside justifies the additional investment, and at which level the business remains profitable.
These tools are especially valuable in uncertain or volatile environments, such as during periods of economic instability or when entering new markets. Scenario planning and sensitivity analysis allow you to assess the potential risks and rewards, and formulate strategies that provide flexibility and resilience in the face of changing conditions.
Financial Performance Evaluation
Financial performance evaluation is essential for any business that wants to stay on track with its goals and objectives. A financial model template offers an efficient way to assess a company’s financial health by calculating and analyzing various financial ratios and metrics. These ratios provide insight into how well a company is managing its resources, profitability, and long-term sustainability.
Financial models enable businesses to track key performance indicators (KPIs) such as return on investment (ROI), gross margin, net profit margin, and current ratio. These KPIs provide a clear picture of operational efficiency, profitability, and liquidity. For instance, a strong ROI indicates that the company is generating solid returns on its investments, while a high gross margin suggests that the business is managing production costs effectively.
Another important financial metric often used in performance evaluation is earnings before interest, taxes, depreciation, and amortization (EBITDA). This metric helps to isolate operational performance by removing the effects of financing and non-cash expenses. By tracking EBITDA over time, businesses can measure the effectiveness of their core operations and identify opportunities for cost reduction or operational improvements.
Financial models also make it easier to track cash flow performance—especially in businesses where managing cash is critical to survival. By assessing free cash flow and operating cash flow, companies can evaluate whether they’re generating sufficient cash to cover short-term obligations, invest in growth, or pay down debt.
For example, a growing SaaS company can use its financial model to track customer acquisition costs (CAC), customer lifetime value (LTV), and monthly recurring revenue (MRR). By monitoring these metrics and calculating the ratio of LTV to CAC, the company can evaluate how efficiently it is acquiring customers and whether its revenue model is scalable.
Financial performance evaluation also involves benchmarking your performance against industry standards or competitors. A good financial model template includes features that allow for this kind of comparison, helping you see where your business stands relative to its peers and identify areas for improvement.
By continuously evaluating financial performance, businesses can ensure they’re on track to meet their goals, stay competitive, and identify potential risks before they become larger issues. It helps managers and decision-makers maintain control over financial outcomes and adjust strategies to improve performance.
A financial model template is more than just a tool for creating projections—it’s a vital resource for a variety of business functions, including valuation, budgeting, scenario planning, and performance evaluation. By leveraging these use cases, companies can gain deeper insights into their financial health, identify opportunities for growth, and navigate challenges with a data-driven approach. Whether you’re evaluating an investment, managing your budget, planning for different business scenarios, or assessing performance, a well-designed financial model provides the clarity and flexibility you need to make smarter, more informed decisions.
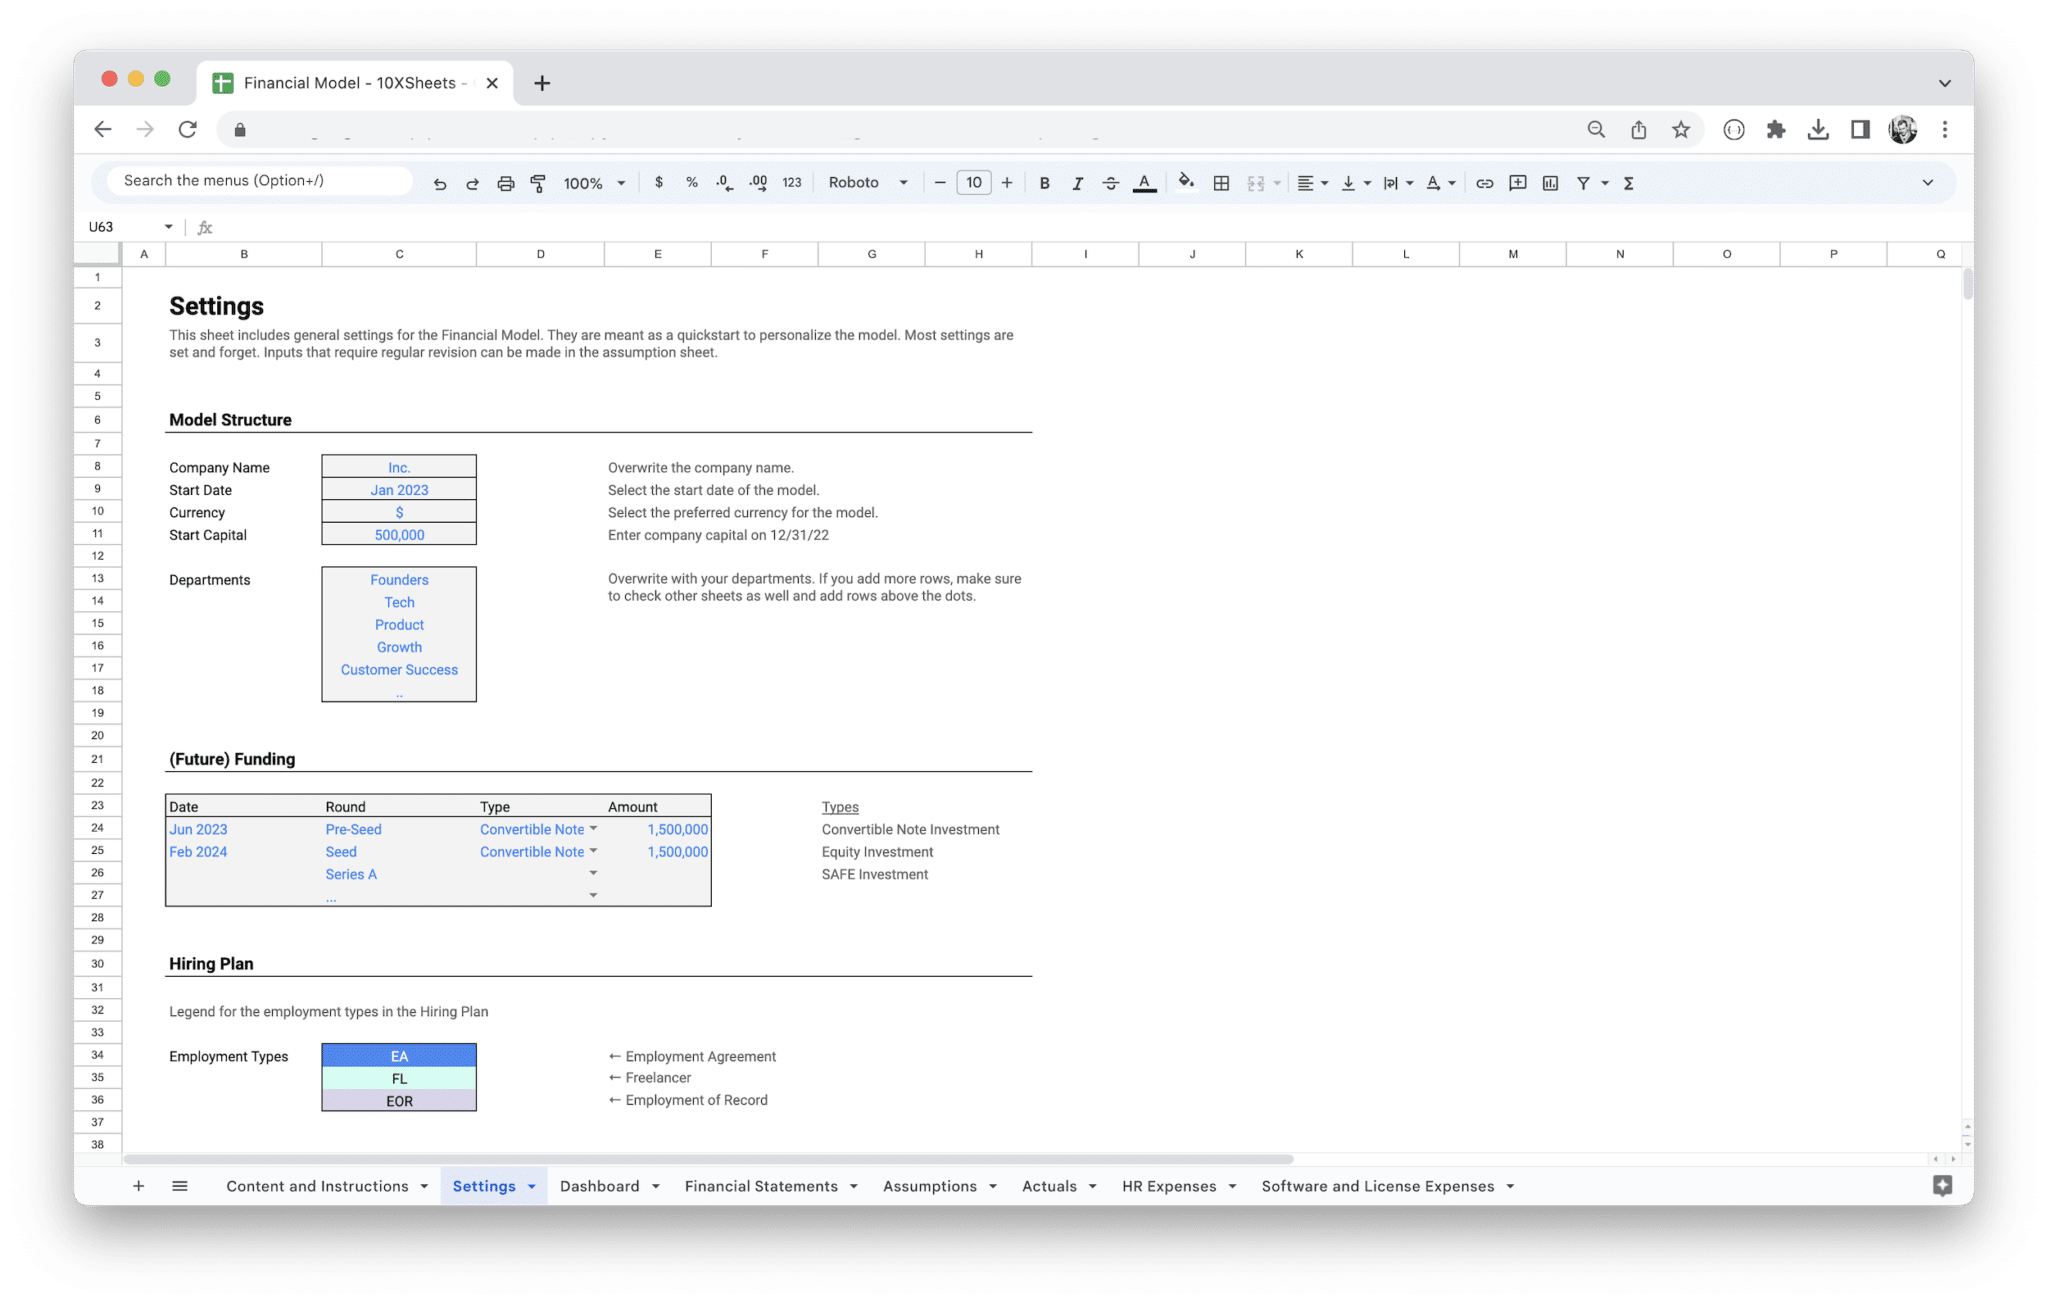
While a standard financial model template provides a solid foundation, customizing it to fit your business needs is key to maximizing its effectiveness. Customizing your financial model ensures that the assumptions and projections reflect the specific circumstances and goals of your business.
- Adjust Assumptions for Your Business: Every business is unique, and your model should reflect that. Modify assumptions such as sales growth rates, pricing strategies, market conditions, or cost structures based on your business model, industry, and goals. This allows the model to align more closely with your expected outcomes.
- Segment Revenue Streams: If your business generates income from multiple sources, such as product sales, services, and subscriptions, customize the template to accommodate these different revenue streams. You can create separate sections for each type of revenue and model them independently, making the template more reflective of your diverse income sources.
- Incorporate Business-Specific Costs: Customize the expense categories based on your specific cost structure. Whether you have high fixed costs (like rent and salaries) or variable costs (like raw materials and commissions), adjusting the cost categories will ensure your model mirrors the reality of your business’s financial operations.
- Add or Remove Financial Statements: Depending on the complexity of your business, you may need additional financial statements or reports. For example, if you’re operating in an international market, you may need to add currency conversion sheets. Alternatively, if you’re a small business with simpler operations, you might not need all the detailed subcategories included in a large corporate model.
- Tailor Forecasting Periods: Most templates come with a default forecasting period (usually one to five years), but this may not suit your business needs. Customize the forecasting period to match your planning horizon, whether you’re looking at quarterly projections, monthly forecasts, or a longer-term outlook.
- Add Sensitivity Analysis: Sensitivity analysis is an essential tool for understanding how changes in key assumptions affect your financial outcomes. Customize your model to include sensitivity analysis features, such as adjusting the assumptions for growth rates or cost changes, to see how different scenarios impact your financial projections.
- Incorporate Key Performance Indicators (KPIs): Customize the model to include the specific KPIs that matter most for your business. These could include customer acquisition cost (CAC), lifetime value (LTV), average order value (AOV), or other metrics that help you gauge performance and guide decision-making.
- Integrate Industry-Specific Metrics: If you’re operating in a niche industry (like SaaS, e-commerce, or manufacturing), adjust the model to include industry-specific metrics that are relevant to your business. For example, a SaaS business might include metrics like monthly recurring revenue (MRR) and churn rate, while an e-commerce business might focus on inventory turnover and conversion rates.
- Adapt for Growth Stages: Businesses go through different growth stages—startup, growth, maturity, and possibly even exit strategies. Adjust your model to reflect these stages, accounting for changes in financing needs, operational efficiency, and capital expenditures. A startup model will likely focus more on revenue growth and fundraising, while a mature business model will emphasize profitability and cash flow management.
- Update Based on Real-Time Data: Customize your model to allow easy updates as real-time data becomes available. For example, you could incorporate actual sales data from your CRM system, integrate data from your accounting software, or adjust forecasted revenue based on new market research or economic trends.
Accurate financial modeling is crucial for making sound business decisions and gaining investor trust. To ensure the accuracy of your model, it’s important to follow best practices, check for errors, and update assumptions regularly. A small mistake can lead to faulty projections, which could cause strategic missteps or even financial mismanagement.
- Double-Check Assumptions and Inputs: The accuracy of your financial model relies heavily on the assumptions and inputs you make. Carefully review each assumption to ensure that it is based on reliable data or realistic projections. For example, double-check market growth rates, customer acquisition costs, or inflation assumptions against credible sources such as industry reports or historical performance.
- Verify Formulas and Calculations: The formulas that power your financial model are the backbone of your calculations. Make sure that all formulas are correctly implemented and return the expected results. For example, verify that your revenue calculations are properly linked to the number of units sold and that expenses are accurately deducted to arrive at the correct profit.
- Ensure Consistency Across Sheets: It’s easy to overlook small inconsistencies between different parts of the model, such as between the income statement, balance sheet, and cash flow statement. Double-check that all data flows seamlessly from one statement to the next, ensuring that changes made in one section automatically reflect in the others.
- Use Validation Tools: Most spreadsheet software offers validation tools that can help you catch errors early. For example, you can use data validation to prevent incorrect inputs, set up conditional formatting to highlight inconsistencies, or use audit tools to trace formula dependencies. These tools help minimize human error and ensure data integrity.
- Test the Model with Real Data: Once your financial model is built, it’s important to test it using actual data where possible. For example, compare past financial results with the model’s projections to see if the model is accurately reflecting reality. This exercise helps you identify areas where your assumptions may need adjustment and improves the overall reliability of your model.
- Perform Sensitivity and Scenario Analysis: Regularly run sensitivity and scenario analysis to test how changes in key assumptions impact the financial outcomes. This helps identify vulnerabilities in your model and ensures that it is resilient to market changes or unexpected events. For example, see how your model holds up under different growth rates, cost assumptions, or economic conditions.
- Review Historical Data and Industry Benchmarks: To make sure your assumptions are realistic, compare them with historical data from your business and industry benchmarks. Look at past performance to understand trends and ensure that your model’s projections are grounded in real-world expectations.
- Seek Peer Review or Expert Input: Having another set of eyes review your financial model can help catch errors or assumptions you may have missed. This could be a colleague, mentor, or financial expert who can provide valuable feedback and suggest improvements.
- Document Your Assumptions and Methodology: Keeping a detailed record of your assumptions and the methodology behind your model allows you to track how the model evolves over time and provides transparency. This is particularly useful if you need to present your model to investors, stakeholders, or other team members.
- Regularly Update Your Model: A financial model is not a static document—it should evolve as your business changes. Regularly update the model with actual data and adjust assumptions based on new market conditions, performance data, or business strategies. This helps maintain the accuracy and relevance of your financial projections.
By following these best practices, you can ensure that your financial model remains accurate, reliable, and useful as a tool for decision-making, financial planning, and investment attraction.
Related products
-
Sale!

Startup Financial Model Template
$119.00Original price was: $119.00.$79.00Current price is: $79.00. Add to cart -
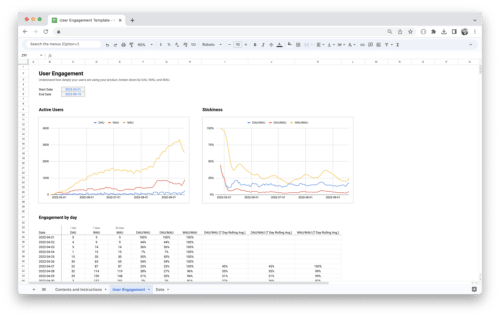
User Engagement Dashboard Template
$0.00 Add to cart -
Sale!

E-Commerce Profit and Loss Statement
$119.00Original price was: $119.00.$79.00Current price is: $79.00. Add to cart -
SaaS Revenue Forecasting Tool
$49.00 Add to cart


