MRR Dashboard Template
$0.00
Description
Managing revenue in a subscription-based business can quickly become overwhelming. Without the right tools, tracking monthly recurring revenue (MRR), monitoring churn, and forecasting future growth can lead to confusion and missed opportunities. Many businesses struggle to stay on top of fluctuating numbers, leading to poor decision-making and inefficient resource allocation. That’s where our MRR Dashboard Template comes in.
Designed to simplify and streamline the entire process, this template provides a clear, real-time view of your MRR and all the key metrics that matter. It helps you easily track your monthly revenue, monitor customer behavior, and make informed decisions based on accurate data. With automatic updates, customizable reports, and easy integration with your existing systems, the MRR Dashboard Template allows you to focus on growing your business rather than managing spreadsheets. Say goodbye to manual tracking and hello to better cash flow management, improved customer retention, and smarter strategic planning. This template is the perfect tool to take control of your revenue and drive sustained growth for your business.
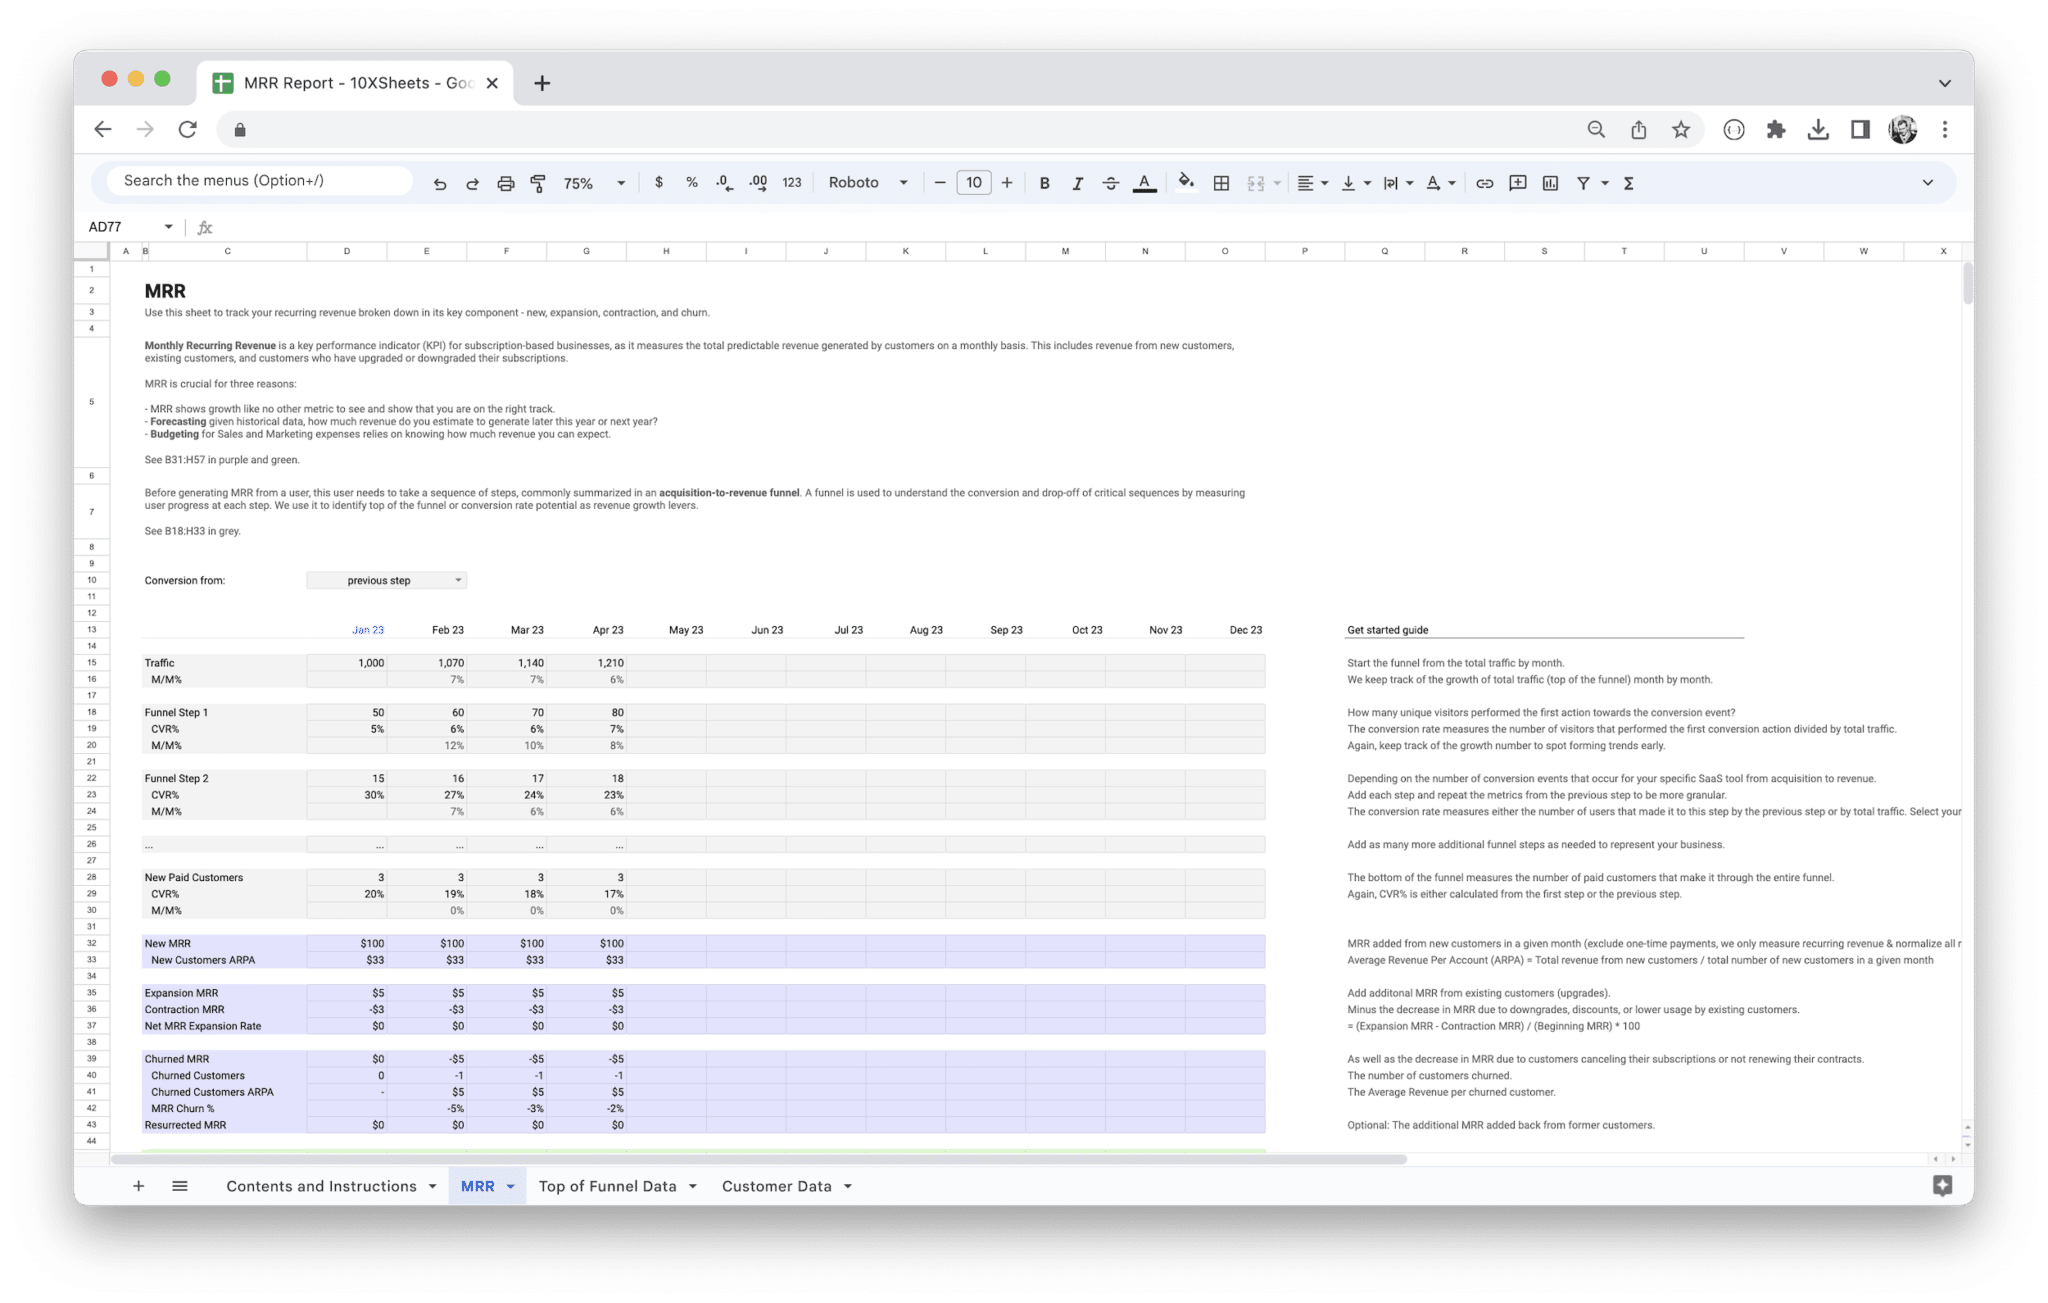
Monthly Recurring Revenue (MRR) is one of the most important financial metrics for subscription-based businesses. It represents the predictable, recurring revenue that a company expects to generate every month from active subscriptions. MRR gives businesses a clear view of their revenue streams, enabling them to forecast growth, manage cash flow, and make informed strategic decisions. It is an essential metric for understanding the financial health of a subscription business, as it reflects the sustainability of its revenue model over time.
What is MRR?
MRR (Monthly Recurring Revenue) is the total amount of revenue that your business earns every month from active subscriptions, including both new and existing customers. Unlike one-time payments or contract-based fees, MRR focuses solely on revenue that recurs on a regular basis. This includes payments made for monthly subscriptions, but it also accounts for annual subscriptions, prorated on a monthly basis, and any other revenue that comes in at regular intervals.
For example, if you offer a software service with a monthly subscription fee of $50, and you have 100 customers, your MRR would be $5,000 ($50 per customer × 100 customers). If you also offer annual plans that cost $600, you would divide the annual payment by 12 to get the monthly recurring portion of that revenue, adding it to the MRR.
MRR helps businesses track growth over time, manage revenue expectations, and understand the value of each customer. It’s a critical measure that helps identify which customers are contributing to stable, recurring income and which segments may need attention for growth or retention.
Importance of Tracking MRR for Subscription-Based Businesses
Tracking MRR is crucial for subscription-based businesses, as it provides a detailed, ongoing snapshot of revenue that is predictable and sustainable. The following are some of the key reasons why MRR is so important for these businesses:
- Revenue predictability: MRR provides a clear picture of how much revenue will be generated every month, allowing businesses to plan their cash flow, staffing needs, and overall strategy with greater accuracy.
- Improved financial planning: By having a steady stream of predictable income, businesses can make better-informed decisions about where to invest resources, whether in product development, marketing, or scaling operations.
- Monitoring customer retention: Tracking MRR helps identify trends in customer churn and retention, making it easier to understand how long customers typically stay with your service and how much revenue is lost due to cancellations.
- Growth insights: By analyzing MRR trends, businesses can identify periods of growth or decline, allowing them to adjust marketing strategies, tweak pricing models, or improve product offerings to capitalize on growth or address dips.
- Investor confidence: Investors and stakeholders often prefer businesses with predictable and stable revenue. By tracking MRR, you can provide reliable insights into your company’s financial health, helping to attract investment or maintain confidence from current investors.
- Identifying expansion opportunities: MRR also highlights how much revenue is coming from expansion opportunities such as upselling, cross-selling, or product upgrades, which can lead to targeted strategies for increasing revenue from existing customers.
What is an MRR Dashboard Template?
An MRR Dashboard Template is a powerful tool designed to help businesses track and analyze their monthly recurring revenue. It allows businesses to visualize various MRR-related metrics, such as customer acquisition, churn, and expansion revenue, all in one centralized place. These templates often integrate with other business tools, such as CRMs, payment processors, and financial platforms, to pull in real-time data and present it in a digestible format.
The primary goal of an MRR Dashboard Template is to provide actionable insights into a business’s revenue performance, helping business owners, managers, and teams make informed decisions based on reliable and up-to-date data. Whether you’re a SaaS company, subscription box service, or membership-based business, an MRR Dashboard Template will help you monitor the health of your revenue streams and identify opportunities for improvement.
The template typically features visual elements like graphs, charts, and tables that represent trends in revenue over time, broken down by different categories like new customers, churn, and upsell performance. These visuals make it easier to spot patterns and areas that require attention, such as an increase in churn or an uptick in customer acquisition.
MRR Dashboard Template Benefits
An MRR Dashboard Template is a vital tool that offers numerous benefits for subscription-based businesses. By providing detailed insights into your recurring revenue, this tool empowers you to make strategic decisions that drive growth and optimize profitability. Below are some of the key benefits of using an MRR Dashboard Template:
- Streamlined revenue tracking: An MRR Dashboard centralizes all of your revenue data, allowing you to track MRR trends, customer behavior, and expansion opportunities all in one place.
- Improved decision-making: By providing real-time data and visualizing revenue patterns, an MRR dashboard enables you to make informed decisions faster and more accurately, whether it’s adjusting pricing strategies, improving customer retention, or scaling operations.
- Enhanced forecasting: With the ability to track MRR trends and account for new, churned, or expanding customers, the dashboard makes it easier to forecast future revenue, helping you plan ahead and allocate resources more effectively.
- Increased operational efficiency: Automating the tracking and reporting of MRR reduces manual work and ensures that your data is always up to date. This allows you to spend more time on strategic initiatives and less time on data entry.
- Better cash flow management: By offering a detailed view of monthly recurring revenue, the MRR dashboard helps businesses manage cash flow more effectively, ensuring that there is enough capital to cover expenses while also investing in growth.
- Transparent performance metrics: The dashboard provides a transparent view of your business’s financial performance, allowing you to measure and share key metrics with stakeholders, investors, or team members.
- Actionable insights for growth: By breaking down revenue into segments such as new customers, expansions, and churn, the MRR dashboard gives you clear, actionable insights into areas of growth and potential issues, allowing you to adjust your strategies accordingly.
- Greater scalability: As your business grows, the MRR Dashboard scales with you, accommodating new products, pricing plans, and customer segments. This flexibility ensures that your tracking remains relevant as your business evolves.
- Performance benchmarks: You can use the dashboard to set benchmarks and track performance over time. Whether it’s monthly revenue goals, churn targets, or customer acquisition rates, the MRR dashboard provides a clear way to measure progress against key objectives.
By using an MRR Dashboard Template, businesses can gain deeper insights into their revenue performance, identify areas of opportunity, and make data-driven decisions that foster long-term growth and profitability.
Using an MRR Dashboard Template offers significant advantages to subscription-based businesses looking to streamline their revenue tracking and make data-driven decisions. By consolidating key metrics and providing real-time insights, this tool enables businesses to optimize their processes, make informed decisions, and ultimately drive growth. Below are some of the most important benefits of utilizing an MRR Dashboard Template:
- Improved Revenue Tracking: Having all your recurring revenue metrics in one place makes it easier to monitor MRR trends, track customer behavior, and identify growth opportunities. The dashboard helps you stay on top of changes and keep your finger on the pulse of your business’s financial health.
- Better Financial Planning and Forecasting: By tracking real-time revenue data and generating forecasts based on historical trends, an MRR Dashboard enables more accurate financial planning. It helps you predict cash flow, anticipate seasonal changes, and prepare for future growth or potential setbacks.
- Faster Decision-Making: With all the necessary data at your fingertips, decision-making becomes faster and more efficient. The ability to instantly visualize and analyze your revenue metrics helps you make adjustments to your strategy quickly and effectively.
- Enhanced Collaboration: Sharing the dashboard with your team promotes collaboration, alignment, and transparency. Everyone involved in revenue-related decisions—from marketing to customer success—can access the same data, ensuring everyone is on the same page when it comes to tracking performance and making improvements.
- Scalability: As your business grows, an MRR Dashboard scales with you. Whether you’re managing a small team or operating across multiple regions with a diverse customer base, the dashboard can handle large data sets and complex revenue streams, providing the insights you need to manage growth effectively.
- Increased Efficiency: By automating data collection, reporting, and visualization, an MRR Dashboard eliminates manual data entry and reporting tasks. This not only saves time but also reduces the risk of errors, providing more accurate and reliable data for analysis.
- Real-Time Monitoring: With real-time data syncing, you can monitor your revenue performance as it happens. This allows you to respond immediately to changes, whether it’s an unexpected drop in MRR or an uptick in customer acquisition. You’re always in the know, which empowers you to make quick, informed decisions.
- Improved Retention and Growth: Monitoring key metrics like churn, expansion revenue, and customer lifetime value on a real-time basis helps you identify areas for improvement in customer retention strategies. You can proactively address retention issues, upsell existing customers, and increase overall customer satisfaction, leading to higher growth and profitability.
- Tailored Insights: An MRR Dashboard allows for deep customization, meaning you can focus on the metrics that matter most to your business. Whether you need detailed segmentation analysis or insights into specific customer cohorts, the dashboard can be adjusted to meet your unique needs, ensuring you get the most relevant data for your business.
- Ease of Reporting: With automated reporting capabilities, the MRR Dashboard takes the hassle out of preparing monthly, quarterly, or yearly reports. You can generate and distribute reports automatically, saving time and ensuring that stakeholders receive timely, accurate information.
An MRR Dashboard Template is more than just a simple tool to track revenue. It’s a comprehensive platform that offers various features to help you manage and grow your subscription-based business. These features not only provide insights but also streamline the entire process of revenue tracking, forecasting, and decision-making. Let’s explore the key features that make these dashboards so powerful and indispensable for your business.
Customizable Metrics and Reports
One of the standout features of an MRR dashboard is its ability to be customized according to the specific needs of your business. No two businesses are the same, and as such, an MRR dashboard should allow you to track the metrics that are most important to you. You can tailor the dashboard to show metrics such as monthly recurring revenue, churn rate, customer acquisition costs, customer lifetime value (CLTV), expansion revenue, and much more.
Customization is vital because it lets you focus on the KPIs that align with your business model and growth objectives. For example, if you are running a SaaS business, you might want to track how much new revenue is generated from upsells or cross-sells. On the other hand, a subscription box business might focus on customer retention and average revenue per user (ARPU). Being able to adjust the template to suit these needs ensures that you’re always viewing the most relevant and actionable data.
Additionally, the ability to customize reports is a game-changer for businesses that need to share data with different stakeholders. Whether you need to present data to investors, upper management, or your finance team, customizable reports allow you to generate exactly what’s needed. This flexibility saves you the trouble of manually editing reports or switching between multiple platforms for different insights.
Visual Representation of Revenue Trends
When it comes to analyzing your business’s performance, data visualization plays a crucial role. A well-designed MRR dashboard will provide graphical representations of your data that allow you to easily interpret revenue trends over time. Instead of sifting through endless tables of numbers, you can quickly spot trends, growth patterns, and potential issues by viewing clear charts and graphs.
Common visualizations in MRR dashboards include line charts, bar charts, and pie charts. Line charts are often used to show revenue growth or decline over time, giving you a clear view of whether you are on target for your monthly, quarterly, or yearly goals. Bar charts can be useful for comparing revenue across different customer segments or subscription tiers. Pie charts might be used to break down the sources of your revenue, such as new customers, existing customers, or upsells.
The visual nature of these dashboards makes them incredibly easy to understand, even for people who may not be as comfortable with data. Having a visual representation of your MRR allows you to quickly assess your financial health and make informed decisions, whether you’re planning for future growth, identifying bottlenecks, or adjusting your pricing strategy.
Integration with CRM and Financial Systems
For any business to operate efficiently, it’s essential to have all systems working in harmony. A major advantage of using an MRR dashboard is its ability to integrate seamlessly with your existing CRM (Customer Relationship Management) and financial systems. This integration ensures that your dashboard pulls data in real time, providing you with the most up-to-date and accurate information possible.
CRM software like Salesforce or HubSpot is where customer data is stored. When integrated with your MRR dashboard, the template can automatically pull in relevant customer information, such as subscription plans, renewal dates, and customer status. This saves you from manually inputting data and ensures that you’re always working with the most current details.
Financial systems like QuickBooks or Xero also play a critical role in ensuring that your revenue tracking is accurate. By integrating your MRR dashboard with these tools, you can reconcile your financial data with your recurring revenue metrics, helping to prevent discrepancies and errors. Additionally, this integration allows for easier financial reporting and forecasting, as both your customer and financial data are in one centralized location.
The integration with other tools isn’t limited to CRMs and financial systems either. Some MRR dashboard templates can also sync with email marketing platforms, customer service tools, and even third-party analytics platforms. This connectivity ensures that all aspects of your business are contributing to a comprehensive view of your revenue and performance.
Forecasting and Revenue Prediction Tools
One of the most valuable aspects of an MRR dashboard template is the ability to forecast future revenue and predict growth trends. These forecasting tools use historical data, current trends, and advanced algorithms to predict how your revenue will evolve over time. Predicting future revenue is vital for making strategic decisions about investments, staffing, and operational adjustments.
The revenue prediction tools within the dashboard take into account factors such as churn rate, customer acquisition, and seasonal trends. They can also factor in any external data or business-specific events that might affect revenue, such as upcoming product launches or marketing campaigns. By forecasting your future revenue, you can make proactive decisions that help mitigate risks and maximize opportunities.
For example, if the forecast indicates that revenue might dip in the next quarter due to expected churn or a slowdown in new customer acquisition, you can implement retention strategies or boost marketing efforts to counteract the decline. On the flip side, if the forecast shows that your revenue will increase significantly, you can plan for scaling up operations, hiring additional staff, or investing in new technologies.
The predictive nature of these tools also helps with financial planning and budgeting. By understanding the future trajectory of your revenue, you can set more realistic financial goals and allocate resources more effectively.
Real-Time Data Updates
Real-time data is essential for any business that wants to stay competitive and responsive. An MRR dashboard template that provides real-time data updates is crucial because it ensures that you always have the most current information at your fingertips. Whether it’s daily, weekly, or monthly, the dashboard will automatically sync with your CRM, financial systems, and other integrated tools to ensure that your revenue data is always up to date.
Real-time updates enable you to monitor revenue fluctuations, identify trends as they emerge, and make decisions based on the latest information. This feature is particularly important for subscription businesses where customer acquisition and churn can fluctuate frequently. With real-time updates, you’ll be able to respond quickly to any changes in your revenue or customer base, allowing you to take corrective actions before any potential issues become larger problems.
For instance, if you notice a sudden drop in revenue or a spike in churn, real-time updates allow you to quickly investigate the issue. Maybe there’s been a billing error, a pricing change, or a problem with customer satisfaction that’s leading to cancellations. With instant access to the latest data, you can act fast to resolve the issue and minimize any negative impact on your revenue.
Moreover, real-time data updates make the MRR dashboard an incredibly valuable tool for collaborative decision-making. If your team relies on timely data for performance assessments, growth projections, or budgeting, real-time updates ensure that everyone is working with the same, current information.
The ability to instantly track and analyze changes in your recurring revenue offers a level of agility and responsiveness that would be impossible without real-time data. This keeps you informed, proactive, and ready to make the right decisions to keep your business on the path to success.
When managing a subscription-based business, tracking the right metrics is crucial for understanding your financial health and growth potential. An MRR Dashboard helps you monitor these metrics in real time, providing insights that can guide strategic decisions. These metrics are the backbone of any successful revenue tracking strategy, giving you a clear picture of how your business is performing, where it’s thriving, and where improvements may be needed.
Monthly Recurring Revenue (MRR)
Monthly Recurring Revenue (MRR) is the most important metric tracked on any MRR dashboard. It represents the predictable, recurring revenue your business generates every month from active subscriptions. MRR is an essential metric because it helps you gauge the health of your subscription-based business, predict future cash flow, and make strategic decisions based on reliable data.
The reason MRR is so valuable is because it smooths out the volatility that comes with one-time sales. Unlike one-time purchases or contracts, MRR gives you a clearer picture of consistent income. By monitoring MRR over time, you can identify growth trends, seasonal fluctuations, and the overall direction your business is heading in.
There are various ways to break down MRR for deeper insights, such as:
- New MRR: Revenue generated from new customers or new subscriptions.
- Expansion MRR: Revenue gained from existing customers through upgrades, add-ons, or upsells.
- Churned MRR: Revenue lost due to cancellations or downgrades.
- Net New MRR: The total MRR after factoring in new, expansion, and churned MRR. This gives a true sense of whether your revenue is growing or shrinking.
Tracking MRR is essential for forecasting, as it helps you predict future growth or potential declines based on trends and historical performance.
Customer Churn Rate
Customer churn rate, or attrition rate, is the percentage of customers who cancel their subscriptions within a given period, usually on a monthly or yearly basis. High churn rates can be a sign that something is wrong with your customer experience, product, or pricing strategy, and can have a significant negative impact on your business’s revenue growth.
Churn is particularly important for subscription-based businesses because retaining customers is often more cost-effective than acquiring new ones. If your churn rate is higher than industry standards or your business expectations, it may signal issues such as poor customer support, product dissatisfaction, or pricing misalignment.
Tracking churn on your MRR dashboard allows you to take proactive measures to address retention issues. If churn spikes in a particular month, you can investigate what caused it. Did customers feel they were not getting enough value from your service? Was there a billing issue? Was a competitor offering a better deal? The insights from your churn metric can lead to improvements in product development, marketing, customer service, and overall customer engagement.
Churn is not just about identifying problems; it also offers valuable insights into how you can build more loyalty and satisfaction within your customer base. By minimizing churn, you not only protect your revenue but also increase your long-term profitability.
Customer Lifetime Value (CLTV)
Customer Lifetime Value (CLTV) is a metric that estimates the total revenue you can expect from a customer throughout their relationship with your business. CLTV helps you understand the long-term value of each customer, guiding decisions about marketing spend, customer acquisition strategies, and retention efforts.
Calculating CLTV involves analyzing customer behavior over time, considering factors such as average subscription length, average revenue per customer, and how often customers renew or upgrade. By knowing the lifetime value of your customers, you can determine how much you should be willing to spend on acquiring new customers (Customer Acquisition Cost or CAC), which ensures that your business remains profitable in the long run.
For example, if your CLTV is significantly higher than your CAC, it means you are generating a good return on your investment in customer acquisition. If the opposite is true, you may need to reassess your marketing or sales strategies to improve customer acquisition efficiency.
An MRR Dashboard typically tracks this metric, helping you understand whether your customer base is increasing in value over time. If your CLTV is growing, it may indicate that your business is retaining customers effectively, offering enough value to justify long-term subscriptions. If CLTV is shrinking, it could point to issues such as churn, poor customer experience, or ineffective pricing.
New Customer Acquisition
Tracking new customer acquisition is crucial because it tells you how effectively your marketing and sales efforts are converting leads into paying customers. The more new customers you acquire, the higher your potential for revenue growth. However, it’s important to track not just the number of new customers but also the revenue they bring in, as this helps you assess the long-term viability of your customer acquisition strategy.
New customer acquisition can be analyzed from different angles:
- Customer Growth Rate: The rate at which you are acquiring new customers over time. A high customer growth rate indicates strong demand for your product or service.
- Revenue from New Customers: This shows how much new MRR is being generated by newly acquired customers, helping you assess whether your new customers are a significant source of recurring revenue.
By closely monitoring new customer acquisition through your MRR Dashboard, you can identify which channels or strategies are bringing in the most valuable customers. For example, you may find that a particular advertising campaign or referral program is delivering a higher conversion rate or attracting customers with higher average order values. This insight can help you reallocate your marketing budget or focus on strategies that drive higher-quality leads.
Expansion Revenue (Upsells, Cross-Sells)
Expansion revenue refers to the additional revenue generated from existing customers, whether through upselling (selling a higher-tier subscription), cross-selling (selling related products or services), or adding add-ons. This is a crucial metric for growth, as generating expansion revenue from your current customer base is often more profitable than acquiring new customers.
Upselling and cross-selling are powerful tools for increasing revenue without the need for additional customer acquisition costs. By offering more features, higher-value plans, or complementary services, you can significantly boost your MRR without having to go through the expense and effort of attracting new customers.
An MRR Dashboard can track expansion revenue by breaking down the sources of this additional revenue. Whether it’s from upsells, cross-sells, or both, knowing how much your existing customers are spending on additional products helps you assess the effectiveness of your sales strategies. For instance, if you notice that a significant portion of your revenue is coming from upsells, it might be time to develop new premium packages or enhance your product offerings to drive further growth.
By monitoring expansion revenue, you can also identify opportunities for improving customer engagement and retention. When customers are spending more on your services, it usually means they are satisfied with the value they’re receiving. Expansion revenue, therefore, is not only a sign of healthy growth but also an indicator that your product or service is meeting customer needs.
Revenue per User (ARPU)
Revenue per User (ARPU) is a metric that measures the average revenue generated from each active user or customer over a given period, typically monthly or annually. ARPU is a valuable metric because it helps you understand how much revenue your business is generating from its users on average, which can inform decisions about pricing, marketing, and product offerings.
A high ARPU typically indicates that your customers are either purchasing higher-tier subscriptions or engaging more deeply with your product. Conversely, a low ARPU may suggest that your pricing model is too low, or that many customers are opting for cheaper plans that don’t generate enough revenue.
ARPU can also be used to measure the success of customer upselling or cross-selling strategies. If your business is successfully selling premium packages or additional services, you should see an increase in ARPU over time. By tracking this metric in your MRR Dashboard, you can identify trends and adjust your pricing or sales strategies accordingly.
ARPU is also helpful for forecasting, as it allows you to estimate how much revenue you can generate per user at various stages of growth. For example, if you know your ARPU and you’re planning to increase your customer base, you can project how much additional revenue that will generate, helping you set realistic financial targets.
By regularly tracking these core metrics on your MRR Dashboard, you can gain invaluable insights into your business’s performance. From understanding the health of your revenue streams to optimizing customer acquisition and retention strategies, these metrics help you stay informed, agile, and ready to adapt to changing market conditions. Whether you’re looking to accelerate growth, improve profitability, or optimize your pricing model, these common MRR metrics will provide the data you need to make informed decisions that drive success.
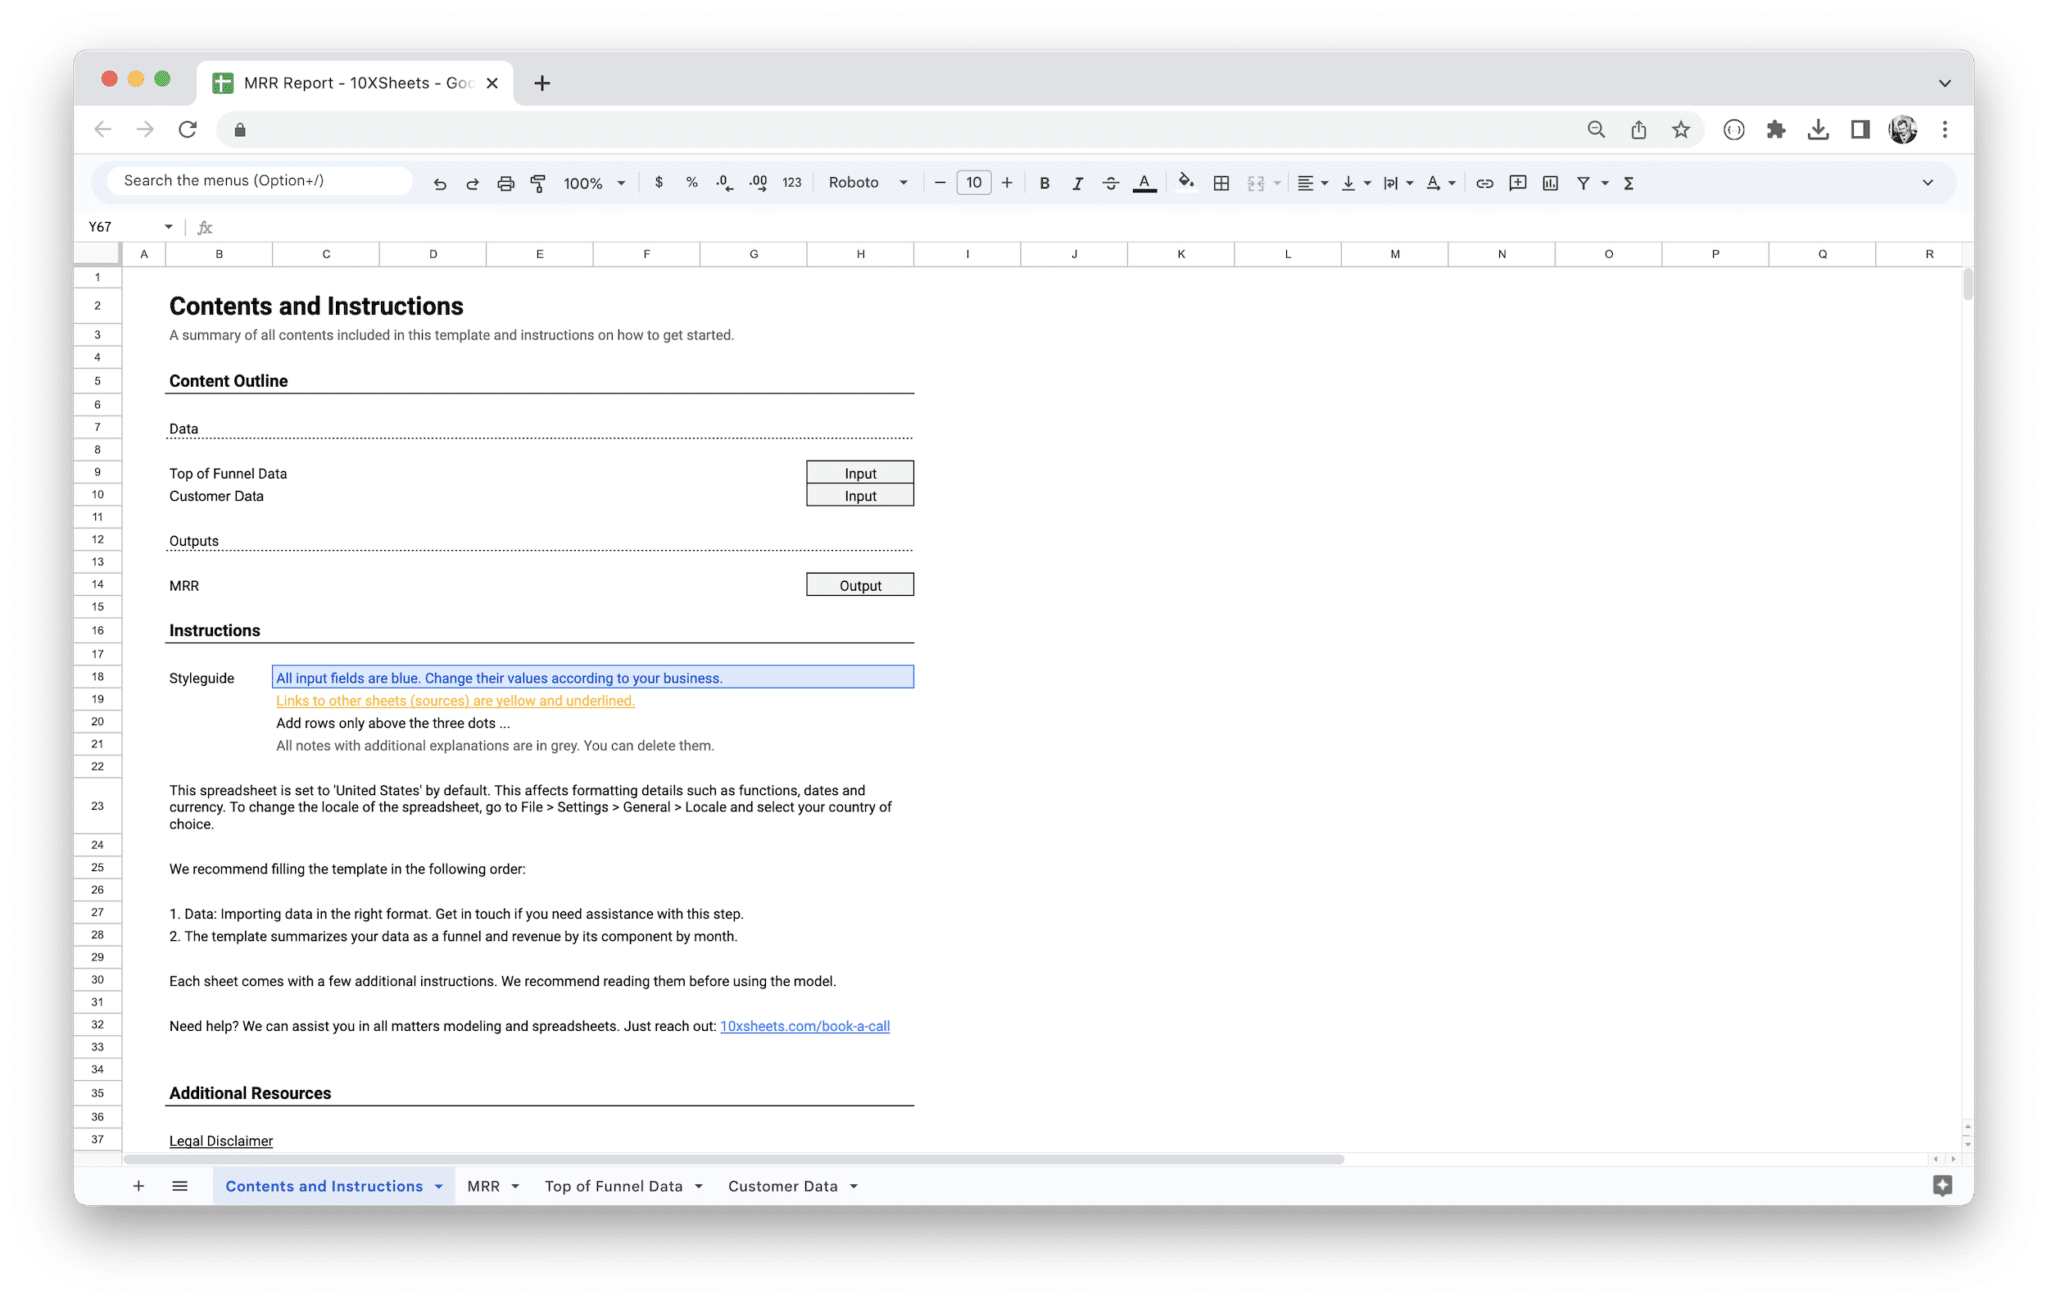
An MRR Dashboard Template is a powerful tool for tracking and analyzing your monthly recurring revenue, but to fully leverage its potential, you need to know how to set it up and use it effectively. This guide will walk you through the steps for setting up the template, customizing it to suit your business, updating it with relevant data, and analyzing your revenue trends. It will also cover how to share and collaborate with your team to ensure that everyone is on the same page when it comes to revenue tracking and decision-making.
1. Set Up the Template for Your Business
The first step in using an MRR dashboard template is setting it up to fit your business model. Most templates come pre-configured with basic metrics, but you’ll need to make sure it aligns with the specific needs of your business. Start by reviewing the template’s features and functionality, ensuring that it includes all the data points you need to track.
Once you’re familiar with the dashboard layout, begin by entering your company’s basic subscription data, such as your pricing structure, subscription tiers, and customer types. If you’re using a CRM or billing system, connect it to the dashboard to pull in real-time data automatically. Most MRR dashboards integrate seamlessly with popular systems like Salesforce, Stripe, and QuickBooks, which makes it easy to sync your revenue data.
Next, input your starting Monthly Recurring Revenue (MRR), which serves as the baseline for tracking future growth or decline. If you’re just starting out and don’t have an established MRR yet, you’ll need to estimate this based on projected sales and customer acquisition.
The initial setup also involves defining the key metrics you want to track. Beyond MRR, consider whether you want to monitor metrics like customer churn, expansion revenue, or customer lifetime value. Make sure to tailor the setup so that you can easily measure the factors that matter most to your business’s success.
2. Customize the Template Based on Your Business Model
Every business has a unique model, and it’s important to customize your MRR Dashboard Template to match yours. If you operate in SaaS, for instance, you may need to focus on metrics like customer retention, upsells, and the value of premium plans. On the other hand, a subscription box business may be more interested in tracking product orders, seasonal trends, and customer acquisition rates.
Customization begins with choosing which metrics to track. Some businesses, for example, may want to track expansion revenue in greater detail, breaking it down into upsell and cross-sell revenue, while others may focus more on tracking churn to identify retention issues. If your business has multiple product offerings or pricing tiers, set up the dashboard to reflect this complexity so you can get an accurate picture of your overall revenue and performance.
In addition to choosing your metrics, you’ll also want to adjust your dashboard’s visual elements. A SaaS business might benefit from a line graph showing the gradual growth of MRR over time, while a business with multiple revenue streams might prefer pie charts to illustrate the proportion of total MRR coming from each customer segment.
Make sure that the customizations you make not only align with your current business model but also anticipate future growth. For instance, if you plan to introduce new subscription plans or product offerings, your template should be flexible enough to incorporate these changes without disrupting your existing tracking structure.
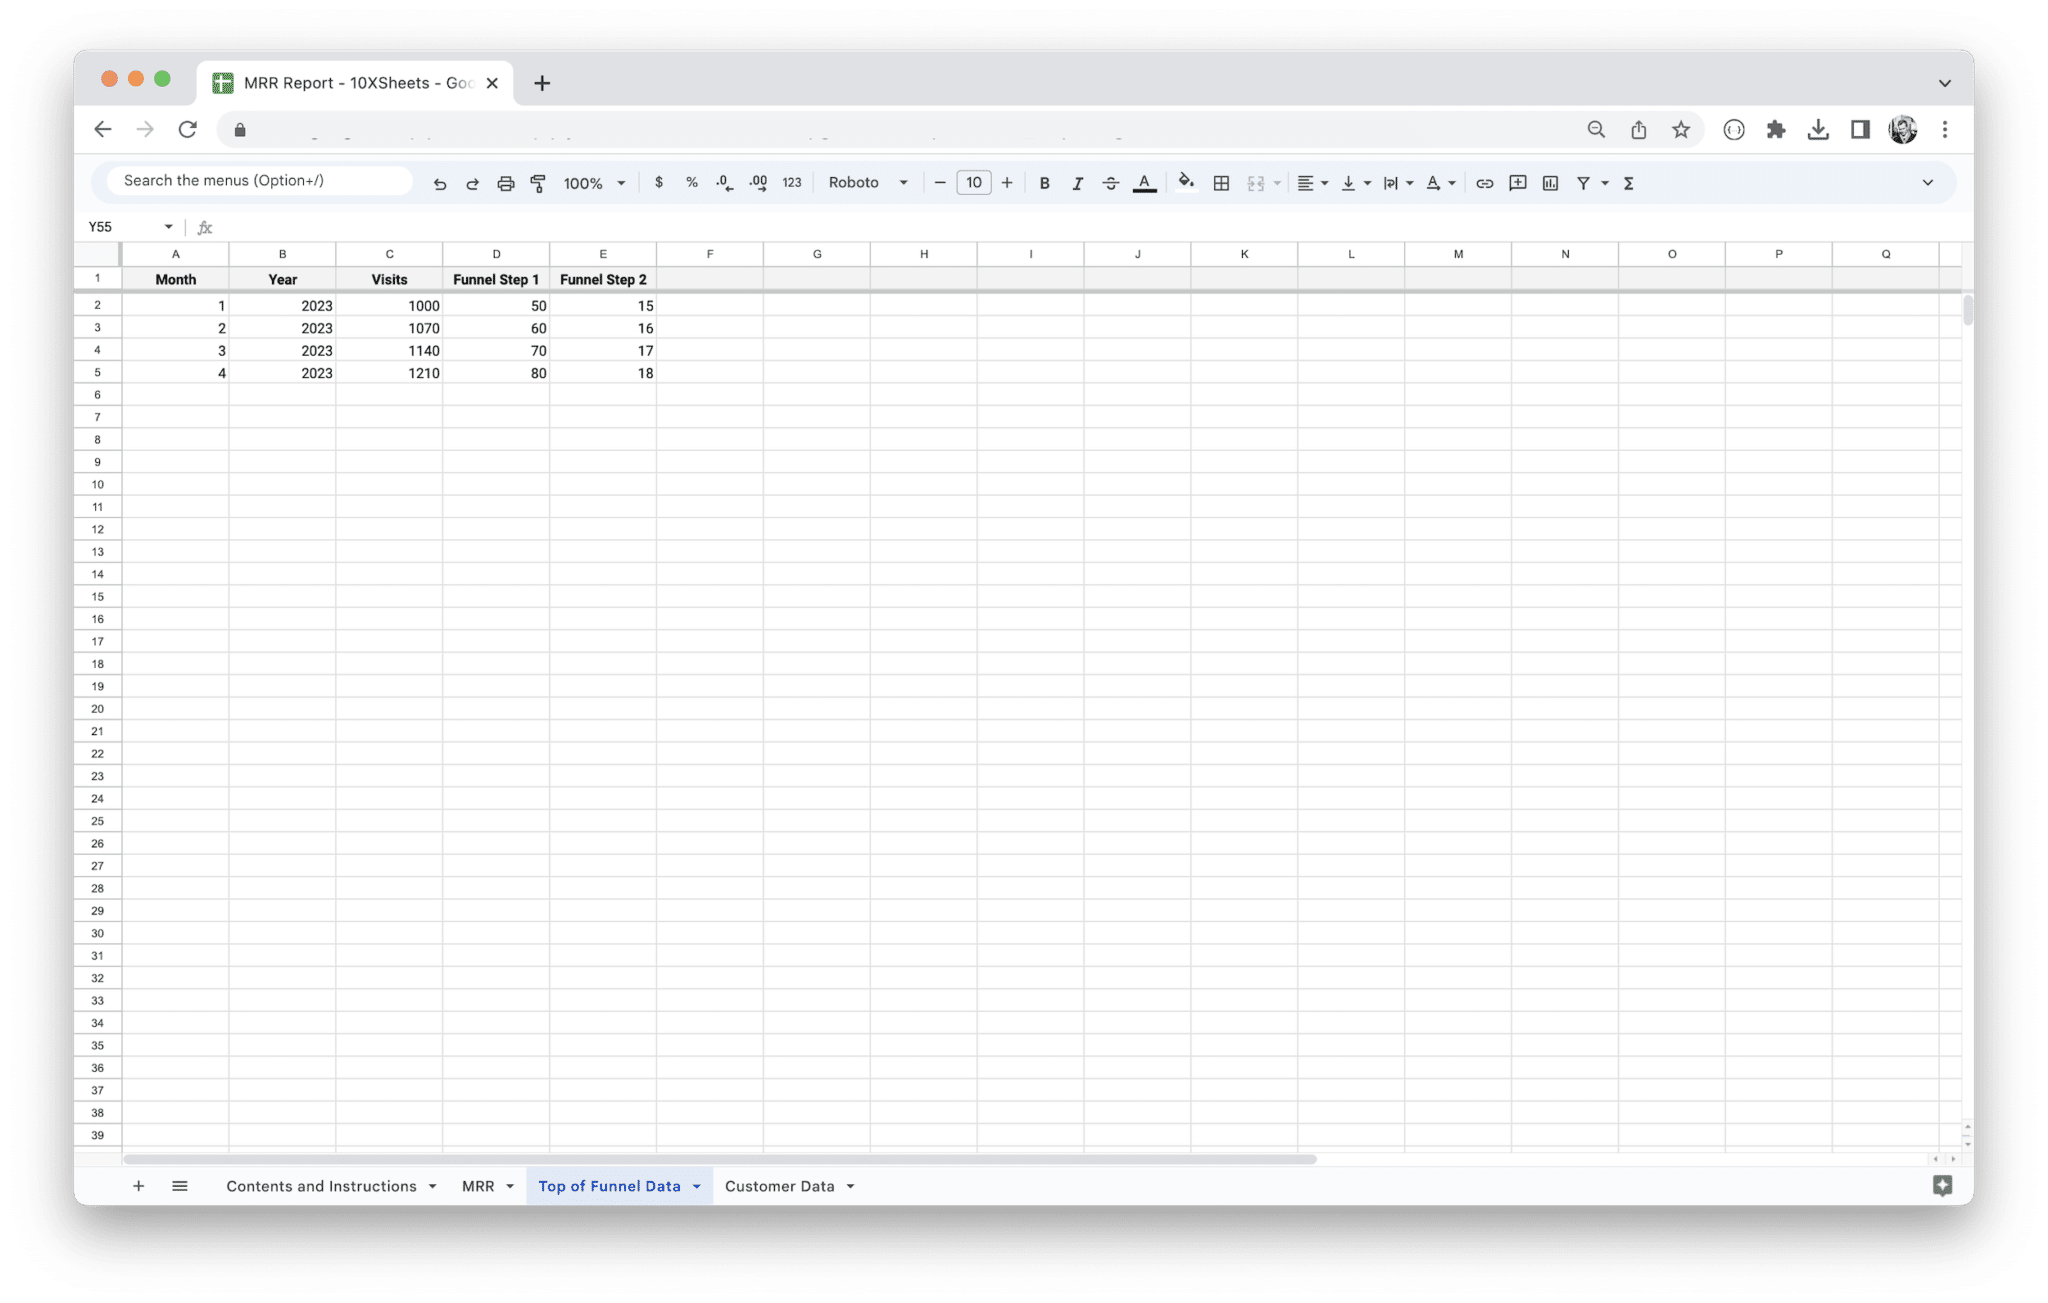
3. Input and Update Data
Once your MRR Dashboard Template is set up and customized, the next step is to begin inputting and updating data regularly. This is where the real power of the template comes into play—by entering accurate, up-to-date data, you’ll be able to generate insights into your revenue performance and trends.
Start by inputting your customer data, including new subscriptions, renewals, upgrades, and cancellations. For many businesses, especially those that are subscription-based, automating this process through integrations with payment platforms, billing systems, or CRM tools is the most efficient way to keep your data updated. For example, if you use a platform like Stripe to manage your payments, you can link it directly to the MRR dashboard so that new transactions are automatically recorded.
Along with subscription data, make sure to update any relevant customer information. This includes tracking customer churn (who’s canceled and why), any changes in customer lifetime value (CLTV), and the addition of new customer segments. The more detailed the data, the better the insights you’ll get.
Keep in mind that data accuracy is key. Inaccurate or outdated data can lead to misleading conclusions and poor decision-making. If you rely on manual data entry, be sure to establish a routine for updating the template—whether that’s daily, weekly, or monthly, depending on the volume of changes to your customer base.
For businesses using a combination of subscription-based and non-recurring revenue, like those with both long-term clients and one-off sales, it’s important to keep track of both MRR and any other revenue streams. The MRR Dashboard should allow you to monitor these alongside one-time payments so you can see the full picture of your business’s financial health.
4. Analyze MRR Growth and Trends
One of the most powerful features of an MRR Dashboard is its ability to help you analyze MRR growth and trends. By tracking revenue over time, you can easily see whether your business is on track to meet its goals or if there are areas that need improvement.
Begin by reviewing the overall trajectory of your MRR. A healthy business will see a steady increase in MRR over time, but fluctuations may occur. Understanding the cause of those fluctuations is crucial for making informed decisions. For example, if you see a drop in MRR in a particular month, it could be due to seasonal trends, customer churn, or changes in pricing. Use your dashboard’s visual tools, like line graphs or bar charts, to compare current data to previous periods and gain insights into any patterns.
Another key area to monitor is the balance between new MRR and churned MRR. If new revenue is outpacing churn, your business is growing, but if churn is starting to surpass new revenue, you’ll want to investigate the cause. Look for any changes in customer behavior or external factors that might be contributing to churn, and consider taking action to address retention issues before they become significant.
Using the data available in your dashboard, you can also look for growth opportunities. For example, if you notice that upsell or cross-sell revenue is contributing significantly to your overall MRR, it might be a sign that your customers are engaging more deeply with your product. In this case, consider developing new offerings or campaigns designed to increase expansion revenue even further.
Predictive tools and forecasting features within your MRR dashboard can also help you project future MRR growth based on historical data. By identifying trends, you can make more accurate forecasts about how your revenue will look in the coming months. This helps with everything from budgeting to strategic planning.
5. Share and Collaborate with Teams
An MRR Dashboard isn’t just for your personal use—it’s an essential tool for cross-functional collaboration within your team. Sharing the dashboard with others ensures that everyone is aligned when it comes to business goals, performance metrics, and decision-making.
When sharing the dashboard, it’s important to highlight the metrics and data that matter most to each team. For example, your marketing team might focus on new customer acquisition and expansion revenue, while your customer success team may be more interested in churn rates and customer lifetime value (CLTV). By customizing the view for each team, you can make sure everyone is working with the most relevant data.
Collaboration goes beyond just viewing the data. Many MRR dashboard templates allow for real-time collaboration, so multiple team members can comment on data points, analyze trends together, and share insights or recommendations. This creates an environment of continuous improvement and helps your team make data-driven decisions.
You can also use the MRR Dashboard to track progress toward specific business goals. Whether you’re working on reducing churn, increasing upsells, or improving customer retention, sharing the dashboard with your team helps ensure that everyone is focused on achieving these objectives. Use it to set targets, monitor progress, and adjust strategies as needed.
Furthermore, sharing the dashboard with stakeholders, such as executives or investors, allows them to have a clear understanding of your business’s financial health and growth trajectory. Having access to a real-time dashboard provides them with the transparency they need to make informed decisions or offer strategic guidance.
Ultimately, the collaborative nature of an MRR Dashboard Template helps foster alignment and accountability across your entire organization. When everyone is on the same page with up-to-date, accurate data, your business is in a much stronger position to grow and succeed.
To fully harness the power of your MRR Dashboard Template and ensure it supports your business growth, it’s essential to follow best practices for setup, data entry, and analysis. These best practices not only help you make the most of the dashboard’s capabilities but also enable you to maintain accurate data and achieve long-term success. Below are some of the key best practices for using your MRR Dashboard effectively:
- Regularly Update Your Data: Ensure that all customer data, subscriptions, renewals, cancellations, and upsells are consistently updated. Whether through integrations with billing and CRM systems or manual entry, up-to-date data is essential for accurate revenue tracking and analysis.
- Customize the Dashboard to Your Needs: Tailor the template to reflect the unique aspects of your business model. Adjust the metrics and visualizations to focus on the areas that matter most—such as customer segments, revenue types, or specific pricing tiers—to ensure you’re tracking relevant data.
- Use Real-Time Data for Decision-Making: Leverage the real-time data syncing feature to make informed, timely decisions. Real-time updates enable you to react quickly to changes in customer behavior, MRR growth, or churn, giving you a competitive edge.
- Segment Your Customers Effectively: Take advantage of detailed customer segmentation to identify valuable cohorts, track their performance, and adjust your strategy accordingly. This will allow you to fine-tune marketing, sales, and customer success efforts to drive higher revenue.
- Set Clear Goals and KPIs: Define your revenue goals, such as MRR growth, customer acquisition targets, or expansion revenue, and use the dashboard to track your progress. Having clear objectives ensures that your analysis is focused and actionable.
- Automate Data Syncing and Reporting: To save time and reduce the risk of errors, set up automated data syncing with your CRM, billing systems, and other platforms. Similarly, automate your reporting process to generate and share reports regularly without manual intervention.
- Monitor Trends, Not Just Numbers: Don’t just focus on the numbers—look at trends and patterns over time. By understanding the story behind the data, you can identify key drivers of growth or areas that need attention, such as customer churn or low expansion revenue.
- Review Dashboards with Your Team: Use the dashboard as a tool for team collaboration. Regularly review the data with your team to identify areas for improvement, discuss strategies for growth, and align on goals. Sharing insights and collaborating will help ensure that everyone is working toward the same objectives.
- Adjust for Growth: As your business scales, your dashboard should evolve with it. Regularly review and refine your metrics, reports, and visualizations to ensure they continue to meet your growing needs. New revenue streams or customer segments may require adjustments to the dashboard setup.
- Keep It Simple and Focused: While it’s tempting to track everything, it’s important to keep the dashboard focused on the key metrics that directly impact your business. Avoid overloading the dashboard with too much data, as this can make it harder to extract actionable insights. Keep the focus on the data that moves the needle for your business.
- Leverage Predictive Analytics for Planning: Use the forecasting and predictive analytics features of the dashboard to plan for future growth. This will allow you to anticipate potential dips or spikes in revenue and prepare strategies to mitigate risks or capitalize on opportunities.
By following these best practices, you can ensure that your MRR Dashboard Template becomes a vital tool for tracking performance, driving growth, and making informed decisions that keep your business on the path to success.
As your business grows and your needs become more complex, the basic features of an MRR Dashboard Template may not be enough. That’s where advanced features come into play, offering tools that help you manage larger data sets, respond faster to market changes, and gain more granular insights. These features allow for a deeper level of customization and automation, making your dashboard not only more powerful but also more efficient. Let’s explore some of the advanced capabilities of an MRR Dashboard Template that can take your revenue tracking to the next level.
Automated Data Syncing and Reporting
One of the most time-consuming tasks in revenue tracking is manually entering and updating data. This is where automated data syncing and reporting can be a game-changer. With this feature, your MRR Dashboard automatically pulls data from various systems—whether it’s your CRM, billing software, or payment gateway—without any manual input. By setting up integrations with platforms like Salesforce, Stripe, or QuickBooks, you ensure that your dashboard always has the latest and most accurate data.
Automated syncing not only saves you hours of manual work but also eliminates human error, ensuring that your data is accurate and up-to-date at all times. This is especially crucial in fast-moving businesses where every minute counts and accurate data is vital for decision-making. For example, if you launch a new marketing campaign and start seeing an influx of new customers, automated syncing allows you to track that new MRR without needing to update the dashboard manually.
Automated reporting is another powerful feature that comes with this level of automation. Instead of manually creating reports for management meetings or investor updates, your MRR Dashboard can automatically generate and send reports at scheduled intervals. Whether you need weekly, monthly, or quarterly reports, the dashboard can pull in the relevant data, format it, and distribute it to stakeholders, saving you valuable time and ensuring that reports are consistent and timely.
Automated data syncing and reporting also allow you to take advantage of real-time insights, ensuring that your decisions are based on the most current data available, without having to wait for manual updates.
Real-Time Updates for Cash Flow and Forecasting
For any business, cash flow is a critical component of financial health. A great MRR Dashboard doesn’t just show past revenue; it offers real-time updates that allow you to forecast future cash flow and revenue growth. This dynamic forecasting is crucial for businesses that need to plan for the future—whether it’s budgeting for expenses, making decisions about hiring, or anticipating investments.
Real-time updates for cash flow mean that as your MRR changes—whether through new subscriptions, churn, or expansion revenue—the dashboard instantly reflects these changes. This allows you to see exactly how much money is coming in, when, and where. With real-time cash flow insights, you can avoid unpleasant surprises, such as running low on cash, because you’re always aware of the state of your finances.
Additionally, real-time updates make forecasting more accurate. By analyzing past trends, the dashboard can project future revenue, helping you understand where your business is headed. If you’re a SaaS business, for instance, knowing your current MRR and churn rates can help you predict future revenue based on customer retention and acquisition trends. This forward-looking capability helps businesses anticipate challenges, like a dip in revenue due to seasonal factors or a potential increase in churn, allowing you to take proactive steps to mitigate risk.
The ability to forecast future revenue with real-time data makes it easier to allocate resources effectively. For example, if the dashboard predicts a decline in revenue next quarter, you may decide to adjust your marketing strategy or introduce retention campaigns to offset the loss. On the flip side, if you see significant growth on the horizon, you can plan for scaling up operations to handle the increased demand.
Custom Alert Systems for Revenue Changes
Revenue changes happen quickly in subscription businesses, and staying on top of them is crucial. This is where custom alert systems within an MRR Dashboard Template can be incredibly valuable. With custom alerts, you can set thresholds for different revenue metrics, and the system will notify you as soon as something important happens. These notifications allow you to respond in real-time to changes in your business, helping you stay agile and avoid potential revenue pitfalls.
For instance, if your MRR drops below a specific threshold or if churn spikes beyond a certain rate, the system can automatically send you an alert, prompting you to take action. These alerts can be tailored to your specific needs. Perhaps you want to be notified when churn exceeds 5% in a given month, or if expansion revenue (upsells and cross-sells) falls below a set target. By having these alerts in place, you can immediately investigate the cause of the revenue shift and adjust your strategy accordingly.
Custom alerts are also useful for monitoring growth. You might set an alert for when your MRR surpasses a specific growth percentage or when your customer acquisition rate increases, helping you track progress toward business goals. Having these real-time notifications at your fingertips allows you to be more proactive and responsive to both positive and negative changes in your business.
These alerts can be configured in multiple ways. You can opt for email notifications, in-dashboard messages, or even text alerts, depending on how urgent the changes are. For example, an alert for a large dip in revenue might require immediate attention, while an alert for slow churn might be something you can address at your weekly review. The flexibility of custom alerts ensures that you’re always aware of the most critical changes affecting your revenue.
Detailed Customer Segmentation Analysis
A key feature of an advanced MRR Dashboard Template is the ability to perform detailed customer segmentation analysis. Not all customers contribute to your revenue in the same way, and understanding the different types of customers you have—and how much each contributes—can be immensely valuable for decision-making. With segmentation analysis, you can categorize your customers based on different characteristics, such as their plan type, location, usage patterns, and more.
For instance, a SaaS business might break down customers into segments like basic, premium, and enterprise users. By segmenting customers this way, you can track the performance of each segment and determine where the most valuable customers are coming from. You may find that enterprise users generate the most MRR, but that churn is higher among basic users. This insight would allow you to focus on improving the retention of basic customers or develop new offerings to cater to high-value enterprise clients.
Customer segmentation analysis goes beyond simple demographic data. By analyzing factors like customer engagement, product usage, and even customer feedback, you can create highly targeted strategies for retention, upselling, and customer support. For example, if a segment of customers shows high engagement with a specific feature, you could offer them a more premium version of the product that includes this feature. Alternatively, if a segment is showing signs of disengagement, you can target them with personalized retention campaigns.
Advanced dashboards allow you to visualize these segments in multiple ways. You can use heat maps, bar charts, and pie charts to easily see which segments are contributing the most to your MRR, which segments are at risk, and which require the most attention. This detailed segmentation allows you to take a more strategic approach to growing your customer base and maximizing revenue from each customer group.
By leveraging segmentation analysis, you gain deeper insights into how different types of customers are interacting with your product, which areas of your business need improvement, and where there are opportunities for expansion or upselling. Understanding these patterns allows you to fine-tune your offerings and marketing strategies to better meet the needs of your most valuable customers.
With these advanced features, your MRR Dashboard Template becomes a comprehensive, powerful tool for managing and growing your subscription-based business. From automating data updates and reporting to providing real-time cash flow insights and custom alerts, these capabilities allow you to respond more quickly to changes, forecast future growth, and make data-driven decisions. Additionally, detailed customer segmentation analysis helps you understand the intricacies of your customer base, enabling you to develop targeted strategies for retention, upselling, and expansion. These features give you the flexibility and foresight needed to take your business to the next level.
Make a one-time payment and
enjoy your template forever.
No extra costs, no strings attached,
more savings for you.
Keep your templates up-to-date
with free access to regular updates.
Related products
-
Sale!


Marketplace Financial Model Template
$219.00Original price was: $219.00.$149.00Current price is: $149.00. -
Sale!


Marketplace Profit and Loss Statement
$119.00Original price was: $119.00.$79.00Current price is: $79.00. -
Sale!


SaaS Profit and Loss Statement
$119.00Original price was: $119.00.$79.00Current price is: $79.00.


