Marketplace Revenue Forecasting Tool
$49.00
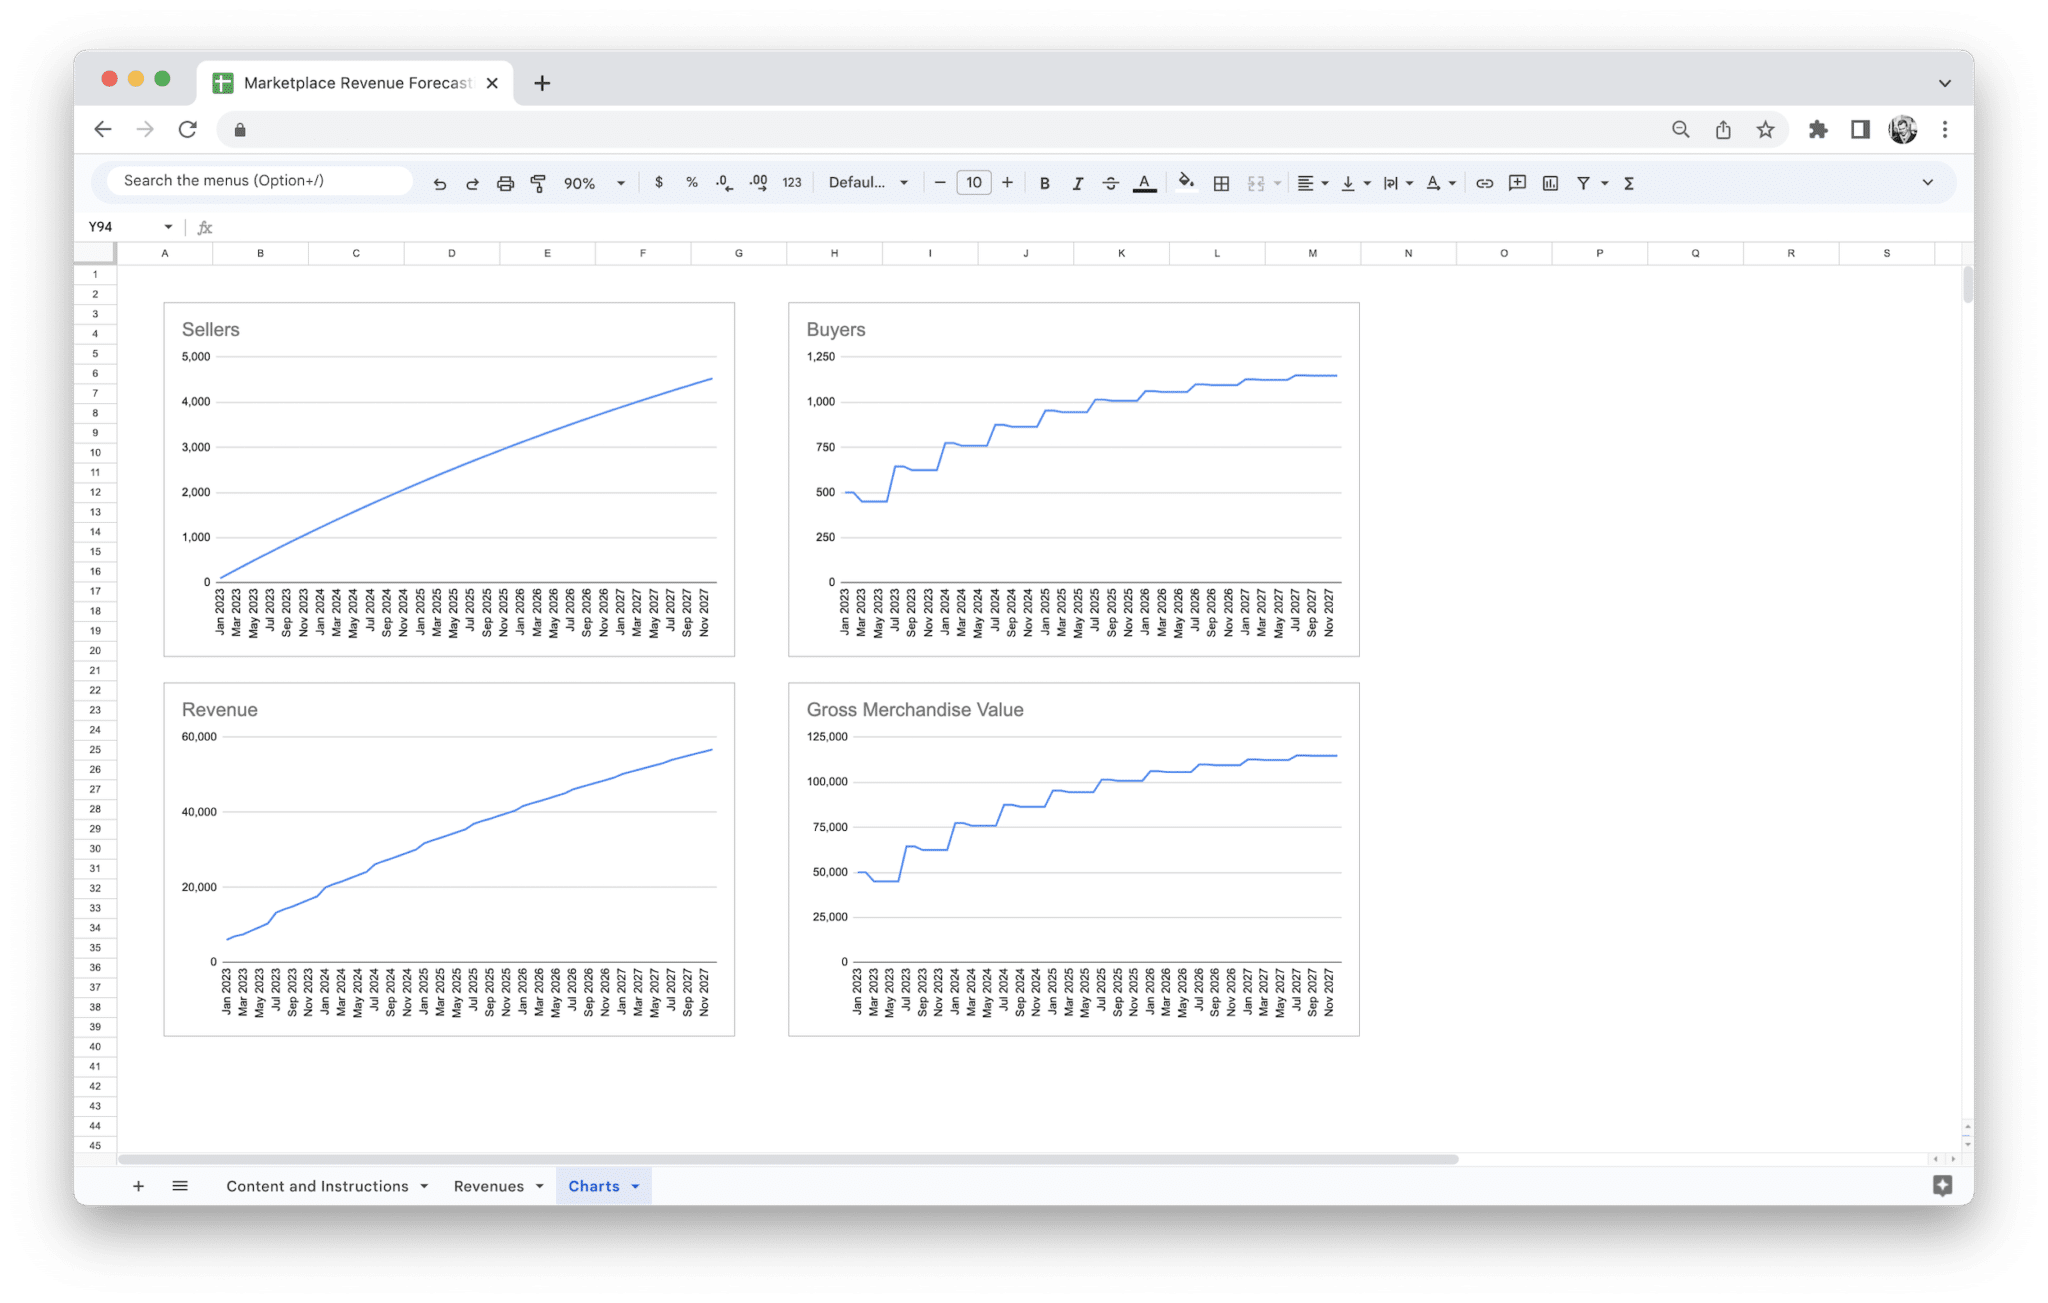
Take control of your Marketplace business with the powerful Revenue Forecasting Tool. Accurately forecast future revenues and visualize key metrics with customizable charts to make informed decisions for your business!
Description
Predicting future revenue can be a challenge for any marketplace business. Without accurate forecasts, it’s easy to make decisions based on guesswork, risking both growth opportunities and financial stability. Whether you’re planning for scaling, managing cash flow, or making informed marketing choices, a lack of precise projections can lead to missed opportunities or wasted resources.
The Marketplace Revenue Forecasting Tool changes all of that. This powerful template provides a simple yet effective way to predict future revenue with accuracy and confidence. By integrating key data points like sales volume, pricing trends, and seasonal variations, the tool generates reliable revenue projections. This allows you to allocate resources wisely, optimize your marketing strategies, and stay ahead of market fluctuations. With the ability to tailor the tool to your marketplace’s unique revenue streams, you gain deeper insights into which areas of your business drive growth. Say goodbye to uncertainty and make smarter, data-driven decisions that set your marketplace up for long-term success.
Revenue forecasting for a marketplace is the process of predicting the future financial performance of your business based on historical data, current market trends, and key assumptions. It’s a way to estimate how much revenue your marketplace will generate over a certain period, whether that’s monthly, quarterly, or annually. Unlike traditional businesses, marketplaces often have complex revenue models that rely on multiple streams, such as transaction fees, subscription fees, listing charges, and advertising revenue. This complexity requires a comprehensive approach to forecasting, one that accounts for all the variables impacting each revenue stream.
Forecasting is based on data-driven insights and assumptions. The goal is to predict revenue with as much accuracy as possible so that you can make informed decisions about growth, investments, and operational strategies. However, forecasting is more than just generating numbers—it’s about understanding how different factors within your business impact your bottom line. Accurate forecasting helps you plan for future demand, allocate resources wisely, and stay ahead of any financial challenges that may arise.
Marketplace revenue forecasting is a dynamic and ongoing process. It’s important to remember that your forecasts will need to evolve over time as new data becomes available, market conditions change, and your business grows. With a solid forecasting system in place, you can stay prepared for both predictable and unpredictable shifts in the market.
Why is Accurate Forecasting Crucial for Marketplace Businesses?
- Helps with financial planning and resource allocation: Accurate revenue forecasts provide a clear picture of expected income, which helps you budget effectively and allocate resources where they’re needed most, whether that’s in marketing, technology, or operations.
- Guides decision-making across all business areas: Whether it’s setting marketing budgets, expanding your product offerings, or determining staffing needs, a reliable revenue forecast supports informed decisions that align with your business objectives.
- Enables better cash flow management: Forecasting helps you predict when cash will be coming in and when you’ll need to cover expenses. This gives you the opportunity to smooth out any cash flow gaps, ensuring that you can pay your bills and manage day-to-day operations without issue.
- Supports business growth and scaling efforts: By accurately forecasting revenue, you can identify the right times to scale your business. Whether it’s expanding into new markets, launching new services, or hiring more staff, a solid revenue forecast ensures that you’re not overextending yourself.
- Improves investor and stakeholder confidence: Investors and stakeholders want to see data-driven forecasts that show how your marketplace will generate returns. Accurate forecasts demonstrate that you have a clear understanding of your business model and are taking proactive steps to ensure growth and sustainability.
- Minimizes risks and prepares for uncertainties: Forecasting helps you anticipate potential risks—such as seasonal slowdowns or market disruptions—so you can plan accordingly. By preparing for the unexpected, you can minimize the impact of any challenges on your revenue.
- Promotes long-term strategic planning: Accurate forecasts don’t just help you manage day-to-day operations; they also serve as a long-term strategic tool. By looking beyond the immediate future, you can set ambitious growth goals, enter new markets, and plan for the next phase of business development.
Benefits of Using a Forecasting Tool Template
- Saves time and reduces manual effort: A forecasting tool template automates many of the calculations and processes involved in revenue forecasting. This eliminates the need for manual data entry and complex calculations, freeing up time for you to focus on strategy and decision-making.
- Improves accuracy and consistency: Templates provide a structured framework for entering and analyzing data, ensuring that your forecasts are more consistent and less prone to human error. This leads to more reliable projections that can guide your business decisions with confidence.
- Customizable to fit your business model: A good forecasting tool template allows you to tailor the input fields and assumptions to your specific marketplace. Whether your revenue comes from commissions, subscriptions, or multiple streams, you can adjust the template to suit your needs and ensure accurate forecasts.
- Integrates with your data systems: Many forecasting templates are designed to integrate seamlessly with your marketplace’s existing data systems. This means you can automatically pull in historical data, sales figures, and other metrics, reducing the risk of errors and making the forecasting process more efficient.
- Supports scenario planning: Forecasting tools often allow you to create multiple scenarios (e.g., best-case, worst-case, and most likely case) based on different assumptions. This gives you a more comprehensive view of potential revenue outcomes and allows you to plan for various business conditions.
- Offers insights into key revenue drivers: A forecasting tool template breaks down your revenue streams, giving you insights into which aspects of your marketplace are driving growth and which need attention. This allows you to focus your efforts on the areas that have the greatest impact on your bottom line.
- Enhances collaboration across teams: By using a standardized template, all stakeholders—whether in finance, marketing, or operations—can work with the same data and assumptions. This fosters better collaboration and alignment across your organization, ensuring everyone is on the same page when it comes to revenue projections.
- Easy to update and refine: As market conditions change or new data becomes available, you can easily update your forecasting tool. This flexibility ensures that your revenue projections remain relevant and accurate, even as your business evolves.
- Provides a clear view of financial health: A revenue forecasting tool template gives you a detailed view of your expected income, broken down by revenue stream. This helps you assess your financial health and make strategic decisions about where to focus your resources and efforts for maximum impact.
A marketplace revenue forecasting tool is designed to help you predict the future performance of your business. It does this by taking a variety of inputs, processing them, and outputting forecasts based on historical data and assumptions. These tools are often highly customizable, enabling you to tailor them to your marketplace’s unique needs.
Key Features and Metrics in the Tool
At its core, a marketplace revenue forecasting tool will typically include a set of features designed to calculate and project your revenue. Some of the most common components include:
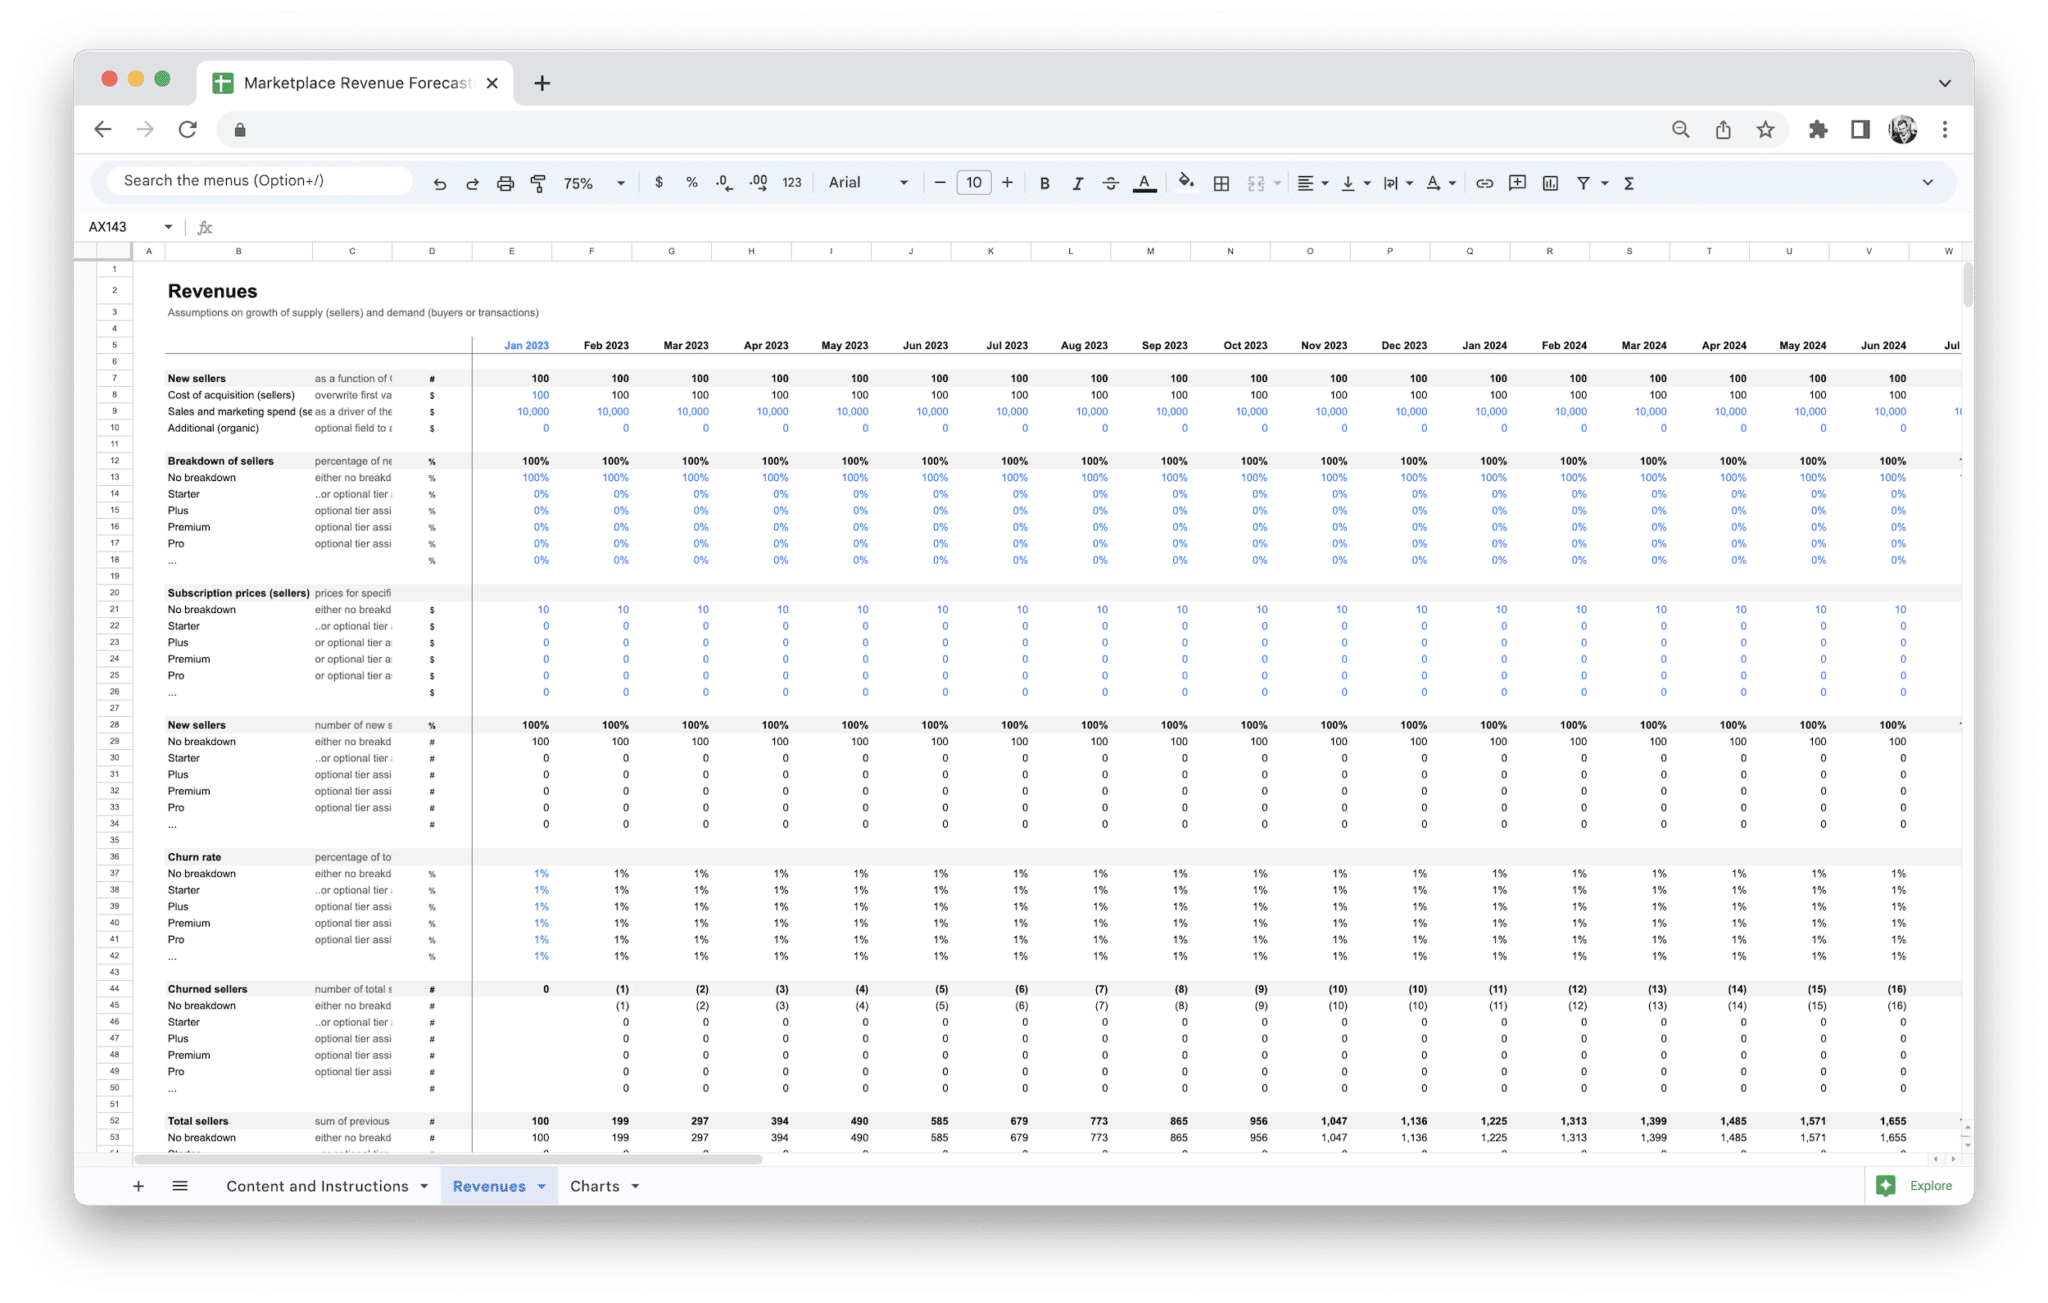
- Input Fields for Core Data: These are the areas where you’ll enter essential data, such as the number of active users, average order value, or the number of transactions. The tool needs this data to establish a baseline from which to make projections. For a marketplace, this could also involve data on the number of sellers, transaction volume, and customer acquisition costs.
- Revenue Streams: Marketplaces often have multiple revenue streams, such as commissions, listing fees, subscription fees, advertising income, and payment processing fees. A forecasting tool can break down how much each revenue stream contributes to overall income, making it easier to spot areas where your business is excelling or needs improvement.
- Historical Performance Data: A good forecasting tool takes historical data—such as past sales, traffic patterns, and seasonal variations—into account. This allows the tool to project future performance based on trends that have already occurred. In some cases, the tool may pull this data directly from your systems (e.g., through integrations with your e-commerce platform or analytics tools), automating the process of inputting data.
- Assumptions and Variables: A crucial feature of any forecasting tool is the ability to account for assumptions and variables. These might include predicted growth rates, expected seasonal shifts, or planned changes to pricing models. Assumptions help you adjust the forecast based on factors you believe will influence future performance. Variables might include things like marketing spend or conversion rate adjustments.
- Scenario Planning: Many forecasting tools come with the ability to run different scenarios based on various assumptions. You can test “best-case” and “worst-case” scenarios to see how changes in key metrics—like traffic or conversion rates—affect your revenue forecast. Scenario planning is useful because it helps you prepare for the unexpected and adjust strategies accordingly.
How These Components Align with Marketplace Revenue Models
Marketplaces are unique in that they often rely on a combination of revenue models to generate income. Unlike a traditional e-commerce business that might only rely on product sales, a marketplace brings together buyers and sellers and charges for various services, including commissions, subscriptions, or listing fees.
A revenue forecasting tool can help align the different revenue components with your marketplace model in several ways:
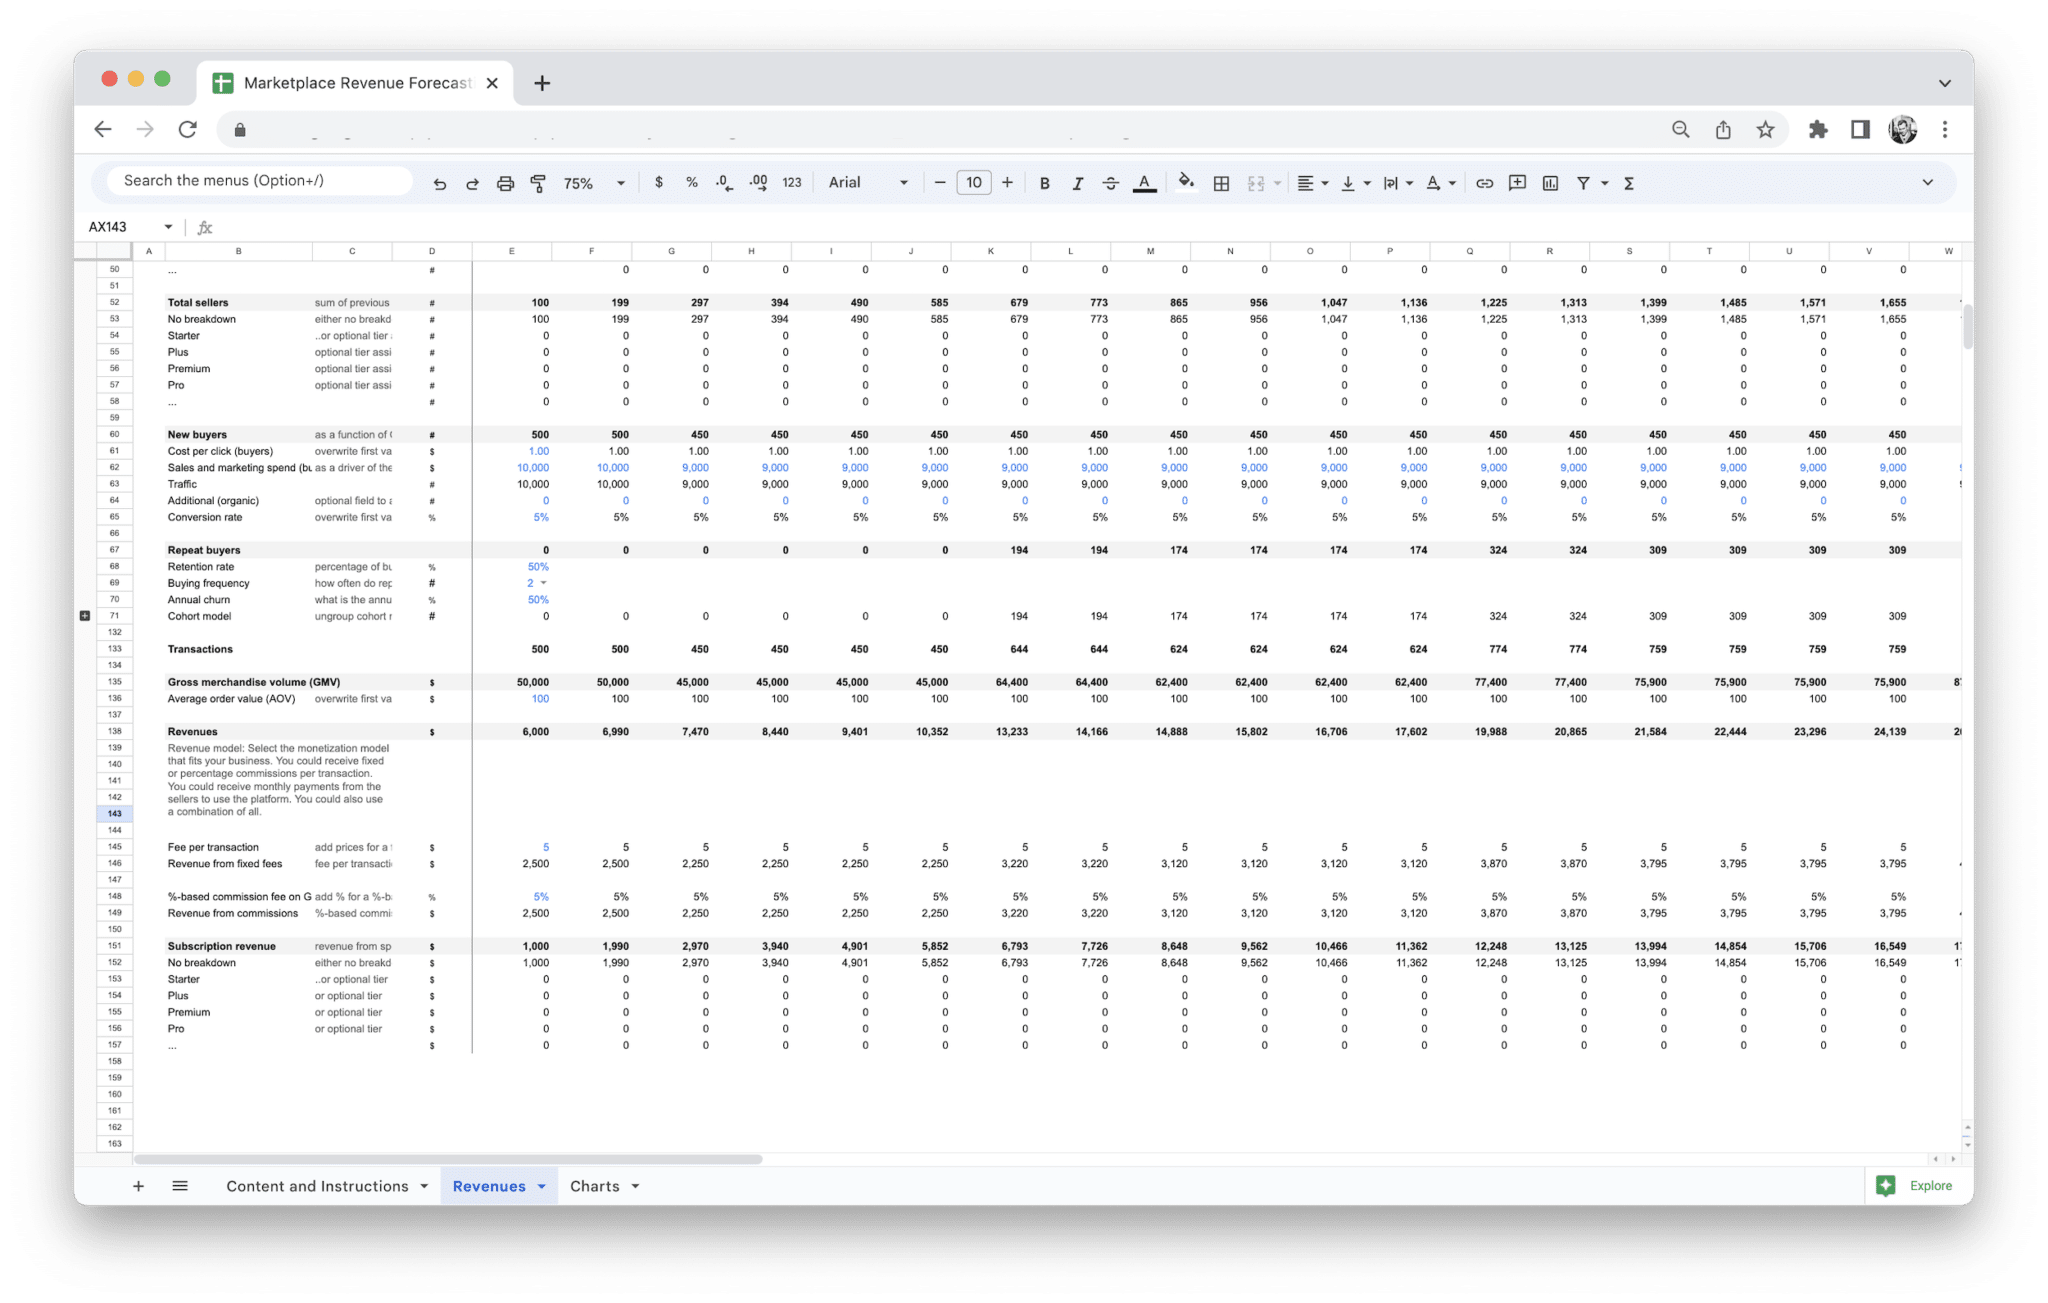
- Transaction-Based Revenue: If your marketplace generates income from commissions on sales, the tool will forecast revenue based on your estimated Gross Merchandise Volume (GMV)—the total value of transactions. This is often the largest source of income for many marketplaces. The forecasting tool can use data such as average order value and expected number of transactions to project total revenue over a set period.
- Subscription Fees: For marketplaces that offer subscription services (either for buyers or sellers), the tool can predict income based on subscription rates, renewal rates, and churn. For instance, if you know that 30% of subscribers are likely to renew their subscription at the end of the period, the tool will factor that into the overall forecast.
- Listing Fees: If your marketplace charges listing fees, the tool will account for the expected number of listings (or listings per seller) and multiply this by the fee. As the number of sellers grows or decreases, this revenue stream will naturally adjust in your forecast.
- Advertising Revenue: For marketplaces that allow third-party ads, forecasting tools can project income from these sources based on factors like the number of active users, impressions, and engagement rates. If you run promotions or special events to drive traffic, these factors will also be included in the forecast to estimate advertising revenue.
Each of these revenue streams requires different inputs and calculations. A strong marketplace revenue forecasting tool brings all these components together to provide an integrated and comprehensive forecast. This means that you can easily see how different areas of your business impact your bottom line.
The Role of Assumptions and Variables in Forecasting Accuracy
While historical data is vital for building forecasts, assumptions and variables play a major role in determining how accurate your predictions will be. Forecasting is never an exact science, and assumptions are often necessary because the future is unpredictable. These assumptions can be about growth, changes in customer behavior, or market conditions, and they need to be constantly updated to ensure your forecasts remain relevant.
- Growth Projections: One of the most common assumptions made when forecasting is that the business will continue to grow. Whether it’s through increasing the number of users or raising transaction volumes, growth assumptions allow you to project how your revenue will scale. But if the business experiences slower growth than anticipated—due to factors like a saturated market or changes in consumer demand—your forecast may need to be adjusted.
- Market Changes: Market conditions can also introduce variables that are tough to predict. For example, new competitors entering the market, changes in customer behavior, or a shift in consumer preferences can all affect your revenue. A forecasting tool allows you to input these assumptions and see how they might affect the overall forecast.
- Seasonality: Many marketplaces experience fluctuations based on the time of year. For instance, a holiday season might see a spike in sales, while the summer months could experience a lull. Forecasting tools typically let you incorporate seasonal assumptions based on historical data, helping you plan for these peaks and valleys.
- Pricing Changes: If you plan to change your pricing structure—whether by increasing fees, lowering commission rates, or introducing new charges—this will affect your revenue forecast. By factoring in anticipated pricing changes, you can see how this will impact overall revenue and profitability.
- External Factors: Events like economic shifts, regulatory changes, or technological advances can also be incorporated into your forecasting assumptions. For example, if new laws are passed that affect your ability to charge certain fees, your forecast will need to reflect these changes.
Inaccurate assumptions or poorly defined variables can result in misleading forecasts. This is why it’s important to continuously update your assumptions based on the latest market intelligence and data. The more realistic and up-to-date your assumptions are, the more accurate your forecast will be. Additionally, running multiple scenarios with different assumptions allows you to gauge the potential range of outcomes, which provides a more complete view of your future revenue.
Ultimately, the accuracy of your revenue forecast hinges on how well you understand and manage the assumptions and variables that drive it. The forecasting tool is only as good as the data you input and the assumptions you make, so it’s critical to approach these elements with careful consideration and regular updates.
When forecasting revenue for your marketplace, tracking the right metrics is essential to generating an accurate and actionable prediction. These metrics are the backbone of your financial projections, offering insight into how different elements of your business contribute to your overall income. By closely monitoring these key performance indicators (KPIs), you can make more informed decisions, adjust strategies quickly, and ensure that your forecast aligns with your business goals.
Gross Merchandise Volume (GMV)
Gross Merchandise Volume (GMV) is one of the most critical metrics for any marketplace business. It represents the total dollar value of goods or services sold through your platform over a specific period. While GMV doesn’t directly translate into revenue for the marketplace, it provides a clear view of your marketplace’s activity and the overall volume of transactions taking place.
GMV includes all sales made, whether or not they are directly linked to your revenue streams. For example, if you charge a commission fee on each transaction, GMV is the total value of all transactions, while your actual revenue will be a percentage of that value. GMV is crucial for understanding the scale of your marketplace and the demand for the products or services being sold.
Tracking GMV allows you to spot trends in sales volume and identify potential areas of growth or decline. If you see GMV increasing steadily, it could indicate rising demand or successful marketing campaigns. Conversely, if GMV is stagnant or declining, it may be time to investigate the causes—whether it’s market saturation, a slowdown in demand, or competition.
Since GMV is a volume-based metric, marketplaces with a commission model will find it particularly useful for projecting future revenue. By calculating your forecasted GMV and applying your commission rate, you can estimate how much revenue you’ll generate from each transaction.
Marketplace Take Rate
The marketplace take rate is the percentage of each transaction that your marketplace retains as revenue. This is a vital metric to track because it determines how much of the GMV you can convert into actual earnings. Depending on the nature of your marketplace, your take rate might apply to all transactions, only those from certain categories, or a mix of commissions, fees, or other charges.
For example, if your marketplace takes a 15% commission on each sale, then for every $100 worth of merchandise sold, you would earn $15. Take rates vary widely between different marketplaces. Some platforms charge a flat percentage across all transactions, while others may implement tiered take rates based on factors like seller volume, transaction size, or membership level.
Tracking your take rate closely is essential for accurate revenue forecasting because even a small fluctuation in the take rate can significantly affect your income. For example, increasing your take rate by a small percentage can have a big impact on your overall revenue, especially if you’re dealing with high transaction volumes. Conversely, lowering your take rate may be necessary to attract more sellers or incentivize buying activity, but it will decrease your revenue per transaction.
When forecasting revenue, you can multiply your forecasted GMV by your average take rate to estimate the revenue your marketplace will generate. This allows you to assess how changes in the take rate affect your projected income and plan accordingly.
Conversion Rates and Customer Acquisition Costs
Conversion rates and customer acquisition costs (CAC) are intertwined metrics that play a significant role in determining the overall health and profitability of your marketplace. Conversion rate refers to the percentage of visitors to your platform who complete a desired action—usually making a purchase or signing up for a subscription. A higher conversion rate means that a larger proportion of your visitors are turning into paying customers, directly affecting revenue.
Customer acquisition cost (CAC) is the amount of money you spend to acquire a new customer. This includes marketing expenses, sales efforts, advertising campaigns, and any other costs associated with attracting new buyers or sellers. Understanding both of these metrics allows you to assess the efficiency of your marketing strategies and whether you’re spending too much to acquire each customer.
Tracking conversion rates is critical because small improvements can lead to significant increases in revenue. For instance, if you can increase your conversion rate by even a few percentage points, you can boost sales without needing to attract additional traffic to your platform. For marketplaces, the key to optimizing conversion rates is understanding the customer journey—from the moment they land on your site to the point they make a purchase. Improving the user experience, reducing friction during checkout, and offering targeted promotions are just a few ways to increase conversions.
Customer acquisition cost plays a pivotal role in determining profitability. If your CAC is too high relative to the revenue generated from new customers, you’ll quickly find that your marketplace is unsustainable in the long run. Ideally, the lifetime value of a customer (CLV) should outweigh CAC by a significant margin. By carefully tracking CAC and comparing it to your conversion rates and average revenue per user, you can ensure that your marketplace is growing in a sustainable way.
In forecasting, both conversion rates and CAC will help you estimate future customer acquisition costs and revenue growth. If you’re projecting a marketing campaign or promotional push, you can predict the number of new customers you’re likely to acquire and the associated costs.
Average Order Value (AOV) and Customer Lifetime Value (CLV)
Average Order Value (AOV) is the average amount spent by customers each time they make a purchase. This metric is important for forecasting because it helps you understand how much revenue you can expect per transaction. For marketplaces, AOV can fluctuate depending on factors such as the type of products sold, the pricing model, or promotional offers.
Higher AOV can significantly boost your revenue forecast, especially if you have a large volume of transactions. To increase AOV, consider strategies like bundling products, offering discounts for larger purchases, or introducing upselling and cross-selling techniques. By tracking AOV over time, you can identify patterns in customer spending behavior and adjust your strategies to maximize revenue.
Customer Lifetime Value (CLV) is another critical metric that indicates how much revenue you can expect from a customer over the entire duration of their relationship with your marketplace. Unlike AOV, which focuses on a single transaction, CLV looks at the long-term value a customer brings. This metric takes into account repeat purchases, upsells, renewals, and subscriptions.
For marketplaces with recurring revenue models, like subscription-based platforms, CLV is especially important. A high CLV suggests that your marketplace can generate sustained income from existing customers, which can support a more predictable revenue stream. By tracking CLV alongside AOV, you can project long-term revenue growth and assess the health of your customer base.
Both AOV and CLV contribute to your revenue forecast by providing insights into the value of your customers. By estimating future AOV and CLV based on historical data, you can predict how much revenue you’ll generate from existing customers and calculate the expected lifetime income from your marketplace’s user base.
Revenue from Fees, Commissions, and Other Streams
Beyond commissions and take rates, many marketplaces have additional revenue streams that contribute to overall income. These can include listing fees, subscription fees, advertising revenue, transaction fees, and service fees. Each of these streams should be tracked individually because they often vary based on different factors.
Listing fees are typically charged to sellers for listing their products or services on the marketplace. These fees can be fixed or variable, depending on factors like product category or seller status. Subscription fees might be charged to either buyers or sellers, offering access to premium features or exclusive content. If your marketplace charges for premium memberships or enhanced visibility, those revenues should also be forecasted.
Advertising revenue is a growing source of income for many online marketplaces. By allowing third-party advertisers to target your users, you can generate significant revenue, particularly if you have a large and engaged user base. Forecasting advertising revenue requires understanding user engagement and impression rates, as well as potential advertising rates.
Transaction fees, payment processing fees, and other charges also contribute to your bottom line. These fees can vary based on the size of the transaction, the type of product sold, or the payment method used. Tracking these fees helps ensure that you’re accounting for all the potential sources of revenue within your marketplace.
By categorizing your revenue streams and forecasting their individual contributions, you can develop a more nuanced and detailed revenue forecast. This allows you to better understand which revenue streams are driving growth and which may need attention. For example, if advertising revenue is not performing as expected, you may need to explore new monetization strategies or refine your targeting approach.
Incorporating all of these metrics—GMV, take rate, conversion rates, AOV, CLV, and additional revenue streams—into your marketplace revenue forecasting tool will provide you with a comprehensive view of your potential earnings. The more accurately you can track and predict these metrics, the more effective your forecasting will be in guiding your business decisions.
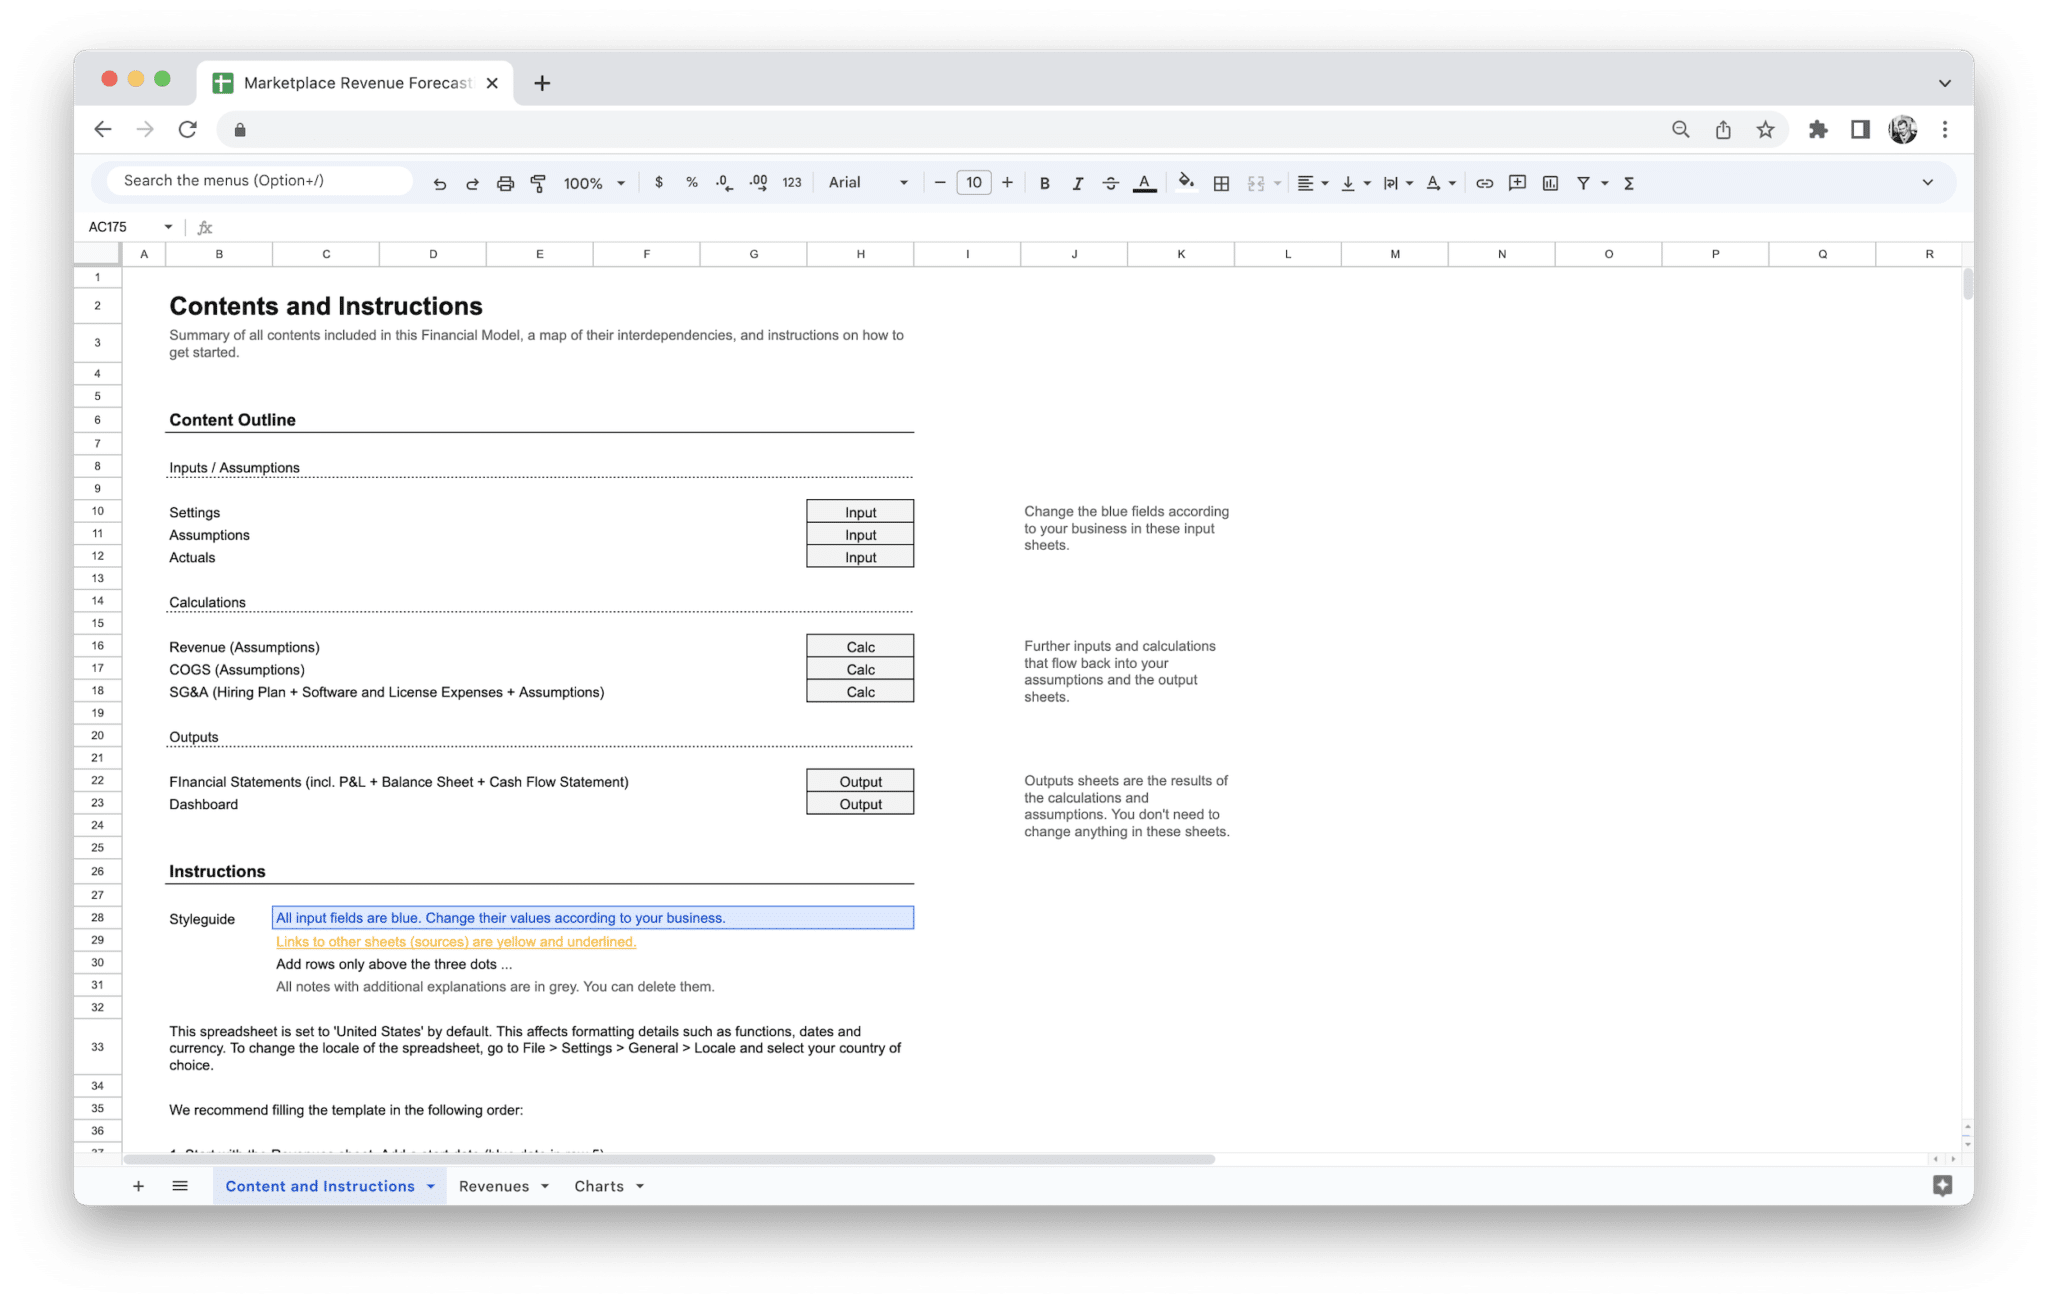
A marketplace revenue forecasting tool template is a powerful asset for businesses looking to predict their future revenue with accuracy. This tool simplifies complex financial forecasting by consolidating key data, metrics, and assumptions into a streamlined process that provides you with clear revenue projections. Understanding how these tools function will help you use them more effectively and integrate them into your marketplace strategy.
Step-by-Step Explanation of the Template’s Functionality
A marketplace revenue forecasting tool typically follows a straightforward process to help you generate revenue predictions. While each tool may have some differences depending on the provider or customization options, the core functionality remains the same.
- Data Input: The first step in using the forecasting tool is providing the necessary data. This typically includes both historical performance metrics (e.g., sales volume, average order value, traffic) and assumptions about future performance (e.g., expected growth rates, pricing changes). The tool relies heavily on this data to make its projections.
- Customizing Your Inputs: Once the basic data is entered, the next step is to customize the inputs according to your marketplace’s specific needs. This may involve adding assumptions about seasonality, marketing campaigns, or new product launches. Many templates come with preset fields for common assumptions, but you have the option to adjust them based on what you know about your marketplace.
- Scenario Setting: Many forecasting tools allow you to set different scenarios based on your assumptions. This is helpful if you want to explore best-case, worst-case, and most likely case scenarios. By adjusting key variables (e.g., growth rate, take rate, traffic), you can see how different situations would impact your revenue forecast.
- Data Processing: Once all the necessary data and assumptions are entered, the tool processes the information using built-in formulas or algorithms. It takes into account all variables—whether they’re historical data or new assumptions—and runs them through the relevant calculations. The processing phase allows the tool to generate a revenue forecast that reflects your business’s potential future performance.
- Revenue Output: After the data processing is completed, the tool generates a report that outlines your revenue forecast over the desired time period. This output will typically include projections for each of your revenue streams (e.g., commission, subscription fees, advertising) and break down how they contribute to the overall forecast. The report can be used to inform budget planning, marketing strategies, and resource allocation.
The functionality of the tool can be as simple or as complex as you need it to be. Some tools offer basic projections with minimal customization, while others provide highly detailed reports with advanced forecasting features. Regardless of complexity, the core idea remains the same: to provide accurate revenue projections based on solid data inputs.
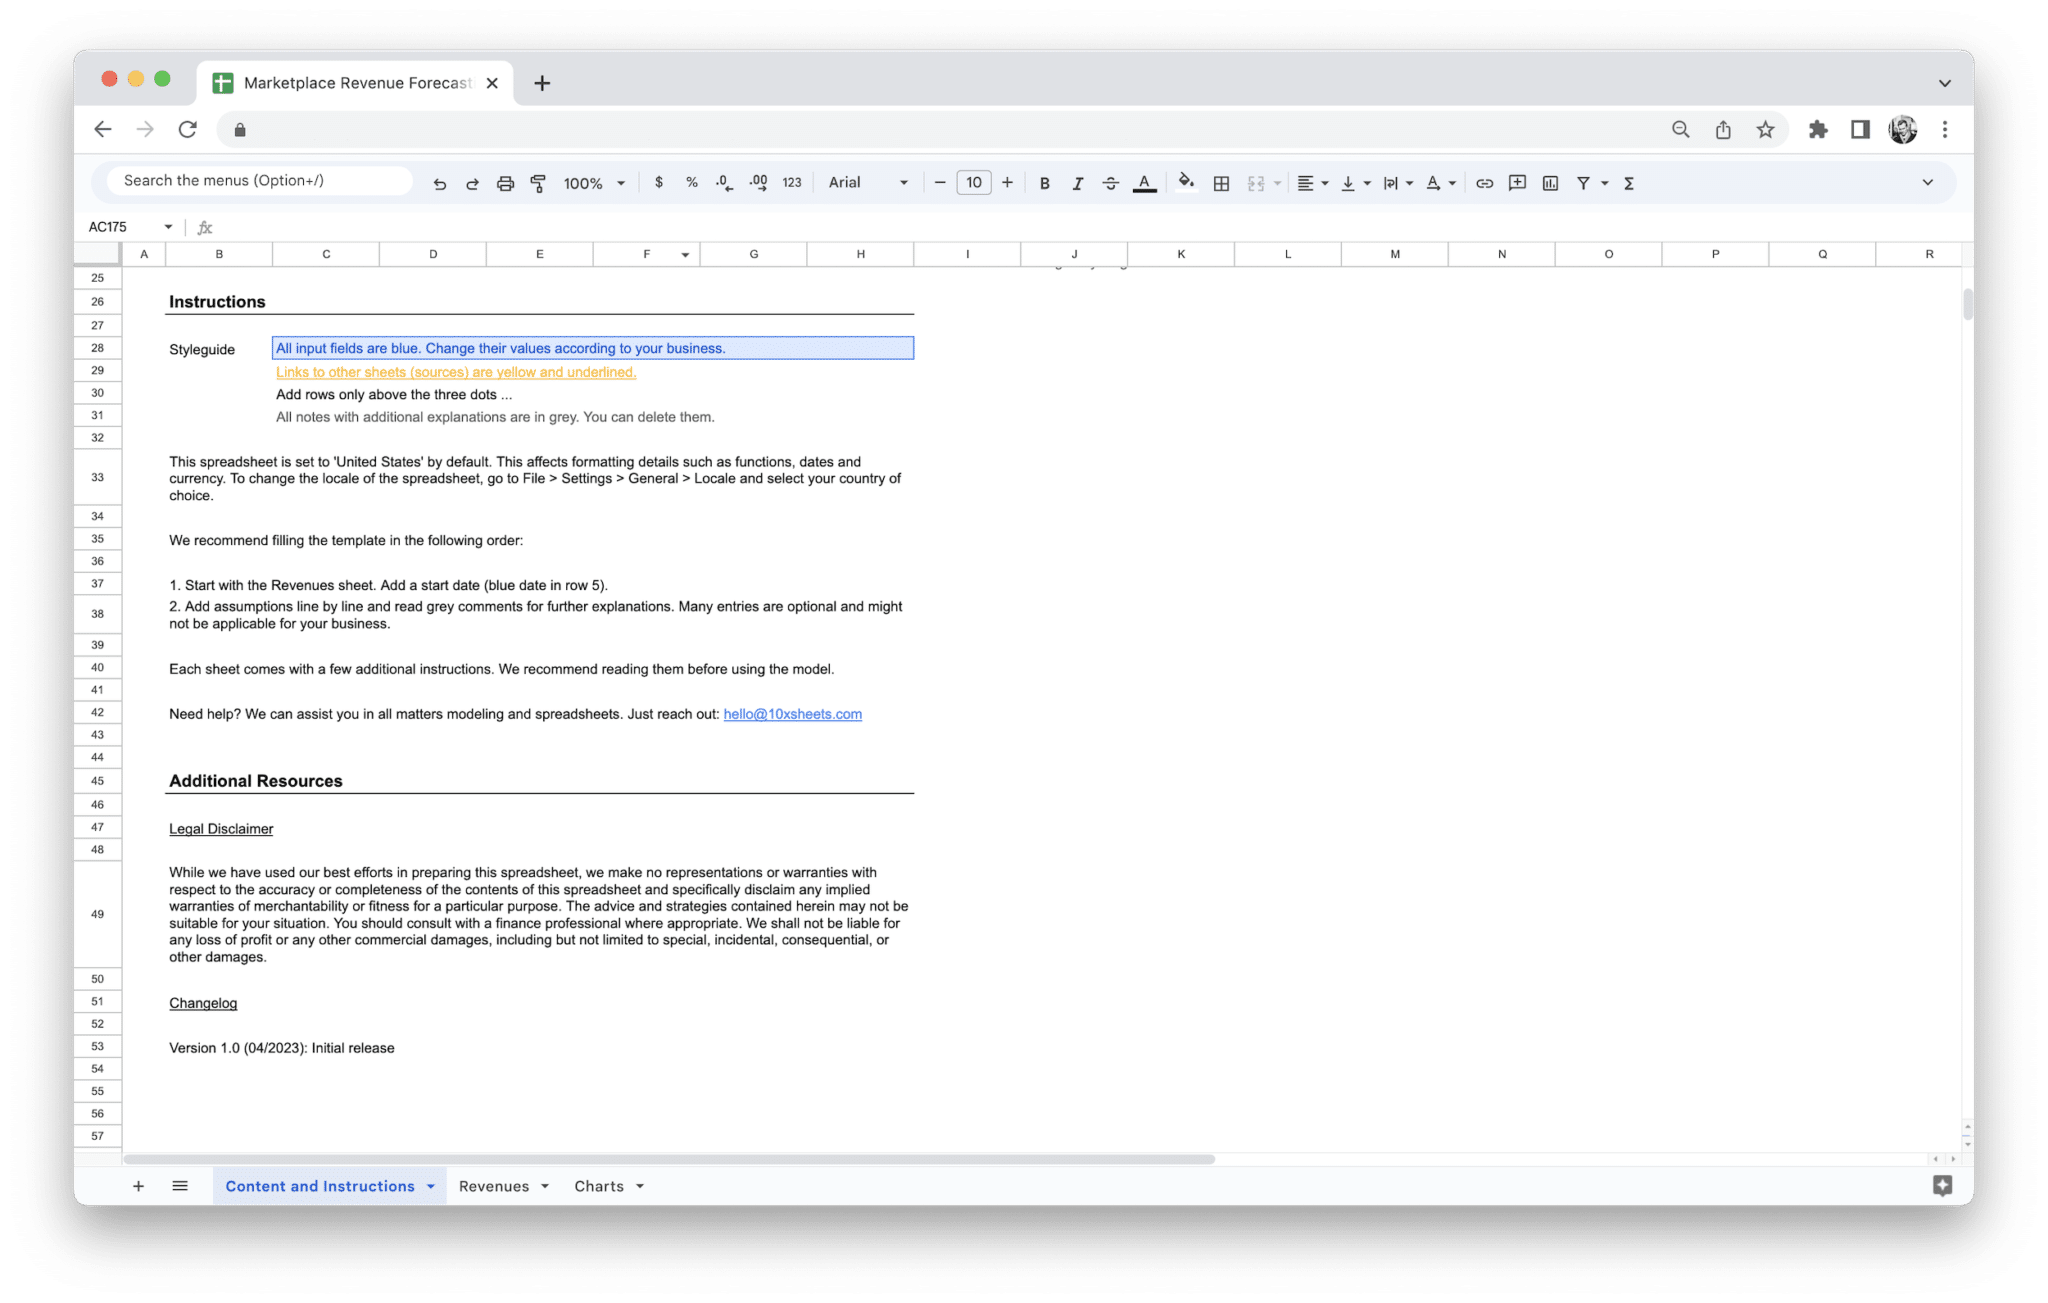
Input Fields: What Data You Need to Provide
The quality of your revenue forecast depends on the quality and accuracy of the data you input into the tool. Therefore, understanding what data is required is crucial for making the most of the tool. The primary input fields that you’ll need to provide include:
- Historical Sales Data: This is perhaps the most important input for your forecast. The tool will need data on your past sales, including transaction volume, revenue, and average order value. For marketplaces, this can include the total value of goods sold (GMV) and revenue from each of your specific revenue streams, such as commissions, subscriptions, or listing fees.
- Traffic Data: Traffic refers to the number of visitors to your platform and is often a key driver of sales. Including historical website traffic data helps the tool make more accurate predictions about future sales based on how much traffic is expected in the forecast period. This could include site visits, unique users, page views, or click-through rates for specific marketing campaigns.
- Conversion Rate: Your marketplace’s conversion rate—the percentage of visitors who make a purchase or complete a desired action—is an essential piece of data for the forecasting tool. By knowing how many visitors typically convert into customers, the tool can better predict future sales based on expected traffic.
- Pricing Assumptions: The tool will need to know any changes you plan to make to your pricing structure, such as increases in listing fees, changes to commission rates, or new subscription fees. You might also input assumptions about promotional discounts or offers that could impact the average order value.
- Customer Acquisition Data: For businesses that rely on marketing or advertising to acquire new users, inputting customer acquisition costs (CAC) data is important. This data helps the tool project the cost of acquiring new customers and how that might affect future revenue growth, especially if you plan on running targeted marketing campaigns.
- Seasonality Data: Many marketplaces experience fluctuating demand throughout the year. If your business has seasonal spikes—such as during holidays or special sales events—be sure to input this data into the tool. This allows the forecasting model to adjust revenue predictions based on anticipated seasonal variations.
- Assumed Growth Rates: You may want to project how your business will grow over time, whether through increasing sales volume, expanding your customer base, or launching new revenue streams. By including expected growth rates for different metrics (e.g., sales growth, new user acquisition), the tool can adjust its forecast to reflect these changes.
- Other Assumptions: You may also need to provide data about other factors that could influence your revenue, such as economic trends, changes in customer behavior, or competitor activity. Some tools allow for additional customizable fields to account for these types of variables.
By inputting accurate data into these fields, you give the tool a solid foundation from which to generate forecasts. The more precise and up-to-date your data, the more reliable the tool’s projections will be.
Customization Options: Adjusting the Template to Your Marketplace Needs
Every marketplace is unique, which is why customization is such an important feature of revenue forecasting tools. A one-size-fits-all approach is rarely effective when it comes to financial projections, so it’s essential to adjust the template to your specific business model, industry, and strategic goals.
- Revenue Model Customization: Marketplaces can operate on a variety of revenue models, including commission-based, subscription-based, or a combination of both. Customizing the template to align with your revenue model ensures that the tool’s calculations are relevant to your business. If you operate a commission-based model, the tool will calculate forecasted revenue based on expected GMV and commission rates. If your marketplace generates revenue through subscriptions, the tool will focus on forecasting recurring income from memberships.
- Market Segmentation: If your marketplace caters to different types of customers or has multiple product categories, you may want to segment your forecasts by these variables. For instance, if your marketplace includes both digital and physical goods, you can customize the template to calculate revenue projections for each category separately. This segmentation allows you to see how different parts of your marketplace are performing and adjust your strategy accordingly.
- Geographical Customization: If you operate in multiple regions or countries, you can tailor the forecast to account for regional differences. For example, if you expect higher sales during certain seasons in one country, you can adjust the template’s inputs to reflect these geographic variations. Customizing for geography allows you to generate more granular forecasts and avoid over-simplifying your predictions.
- Currency Adjustments: For international marketplaces, revenue forecasting tools often allow you to input different currencies. This customization helps you generate accurate forecasts regardless of the currencies your marketplace uses. You can also account for fluctuations in exchange rates if you operate in multiple markets with different currencies.
- Time Period Adjustments: You can customize the tool to generate forecasts for specific periods, whether it’s on a monthly, quarterly, or yearly basis. Some tools also allow for rolling forecasts, where projections are updated regularly as new data comes in. Adjusting the time periods helps you align your forecast with business cycles, planning cycles, or investor expectations.
Customization ensures that the revenue forecasting tool fits your marketplace’s unique structure and needs. By adjusting the template to reflect the specific variables that drive your business, you make the tool far more useful for decision-making and planning.
How the Tool Generates Revenue Forecasts Based on Your Data
Once the necessary data and assumptions have been input into the tool, it uses a combination of algorithms, formulas, and logic to generate your revenue forecast. Depending on the complexity of the tool, the process may vary, but the core steps are generally the same.
- Calculation of Revenue Streams: The tool calculates the revenue for each stream based on your inputs. For example, if you have a commission-based model, it will multiply the GMV by your take rate to estimate the total revenue from transactions. Similarly, if you charge subscription fees, the tool will multiply the number of subscribers by the average subscription rate to forecast recurring revenue.
- Scenario Analysis: If you’ve entered different assumptions for growth, marketing spend, or seasonality, the tool can generate multiple scenarios. It runs simulations to show the effects of different assumptions and outputs a range of possible revenue outcomes. This allows you to prepare for different business conditions and make more strategic decisions.
- Forecasted Revenue Projections: The output of the tool will provide a detailed projection of your revenue over the forecasted period. This includes total revenue, revenue broken down by stream, and any other metrics you’ve customized. Some tools also provide visual aids, like graphs and charts, to help you understand trends and fluctuations in your projected revenue.
- Adjustment and Iteration: As your business environment changes, you can adjust your inputs to see how those changes affect your forecast. Whether you’re launching a new marketing campaign, adjusting pricing, or preparing for a seasonal spike, the tool allows you to update your assumptions and refine your projections. This iterative process ensures that your revenue forecast remains accurate and adaptable.
By leveraging the tool’s data processing capabilities and scenario analysis, you can generate a detailed, actionable revenue forecast that provides the insights you need to make informed decisions and grow your marketplace.
A reliable revenue forecast is crucial for ensuring the long-term growth and sustainability of your marketplace. Whether you’re trying to secure investment, plan marketing campaigns, or allocate resources effectively, a forecast based on accurate and up-to-date data is your best tool for making informed decisions. Building this forecast requires a systematic approach to gathering the right data, making informed assumptions, and adjusting your projections as conditions change.
1. Gather Historical Data: Where to Find It and What to Include
Historical data serves as the foundation of any revenue forecast. It allows you to see past performance, which is one of the best indicators of future trends. By analyzing this data, you can make more accurate assumptions about what’s likely to happen in the future. Gathering historical data involves reviewing both operational metrics and financial figures from previous periods.
- Sales Data: The most important piece of historical data for any marketplace is the sales data. This includes total revenue, Gross Merchandise Volume (GMV), and the income generated from each revenue stream, such as commissions, listing fees, subscription fees, or advertising. Your sales data will reveal trends, such as which periods tend to be the most lucrative or which product categories generate the most revenue.
- Traffic and Engagement Data: For a marketplace, traffic data (e.g., site visits, unique users, page views, session duration) is crucial for understanding the relationship between traffic and sales. More traffic often leads to more transactions, but this depends on your conversion rate, which should also be tracked in the historical data. You can often find this data in your website analytics platform, such as Google Analytics, or through integrated business intelligence tools.
- Customer Behavior: It’s essential to look at customer behavior data, including metrics like conversion rates, average order value (AOV), customer lifetime value (CLV), and retention rates. This data helps you understand how customers interact with your platform and provides insight into how future customer behavior might evolve. For example, if customers are spending more over time or returning more frequently, this trend could continue in the future.
- Seasonal and Promotional Data: Marketplaces often experience seasonal fluctuations in demand. Historical data should include past seasonal spikes, whether driven by holidays, product launches, or marketing campaigns. Understanding how these factors impacted sales and user behavior helps you project similar outcomes for future periods.
This data is typically available through various business systems, such as customer relationship management (CRM) tools, sales and transaction data from your e-commerce platform, and analytics dashboards. Collecting data from as many sources as possible, including both direct sales and external factors (such as seasonal demand), will give you a comprehensive view of your marketplace’s historical performance.
2. Use Assumptions to Project Growth or Seasonal Changes
Once you have a solid historical data set, the next step is to use assumptions to project future growth and seasonal changes. This is where forecasting starts to require judgment calls, as you must make educated guesses based on the data at hand. These assumptions often stem from your understanding of the market, previous growth trends, and any plans or changes you anticipate.
- Growth Assumptions: Marketplaces often experience growth over time, but the rate of that growth can vary. Look at historical sales and user data to estimate your marketplace’s growth rate. If you’ve been growing at 15% per year, this could be a reasonable assumption for your future growth, but you should adjust it based on factors like increased competition, changes in consumer behavior, or new product lines. It’s also wise to create different growth scenarios—conservative, moderate, and aggressive—to understand the range of potential outcomes.
- Seasonal Assumptions: Many marketplaces experience strong seasonal trends. For instance, if your marketplace sees a significant uptick in sales during the holiday season, you need to account for this when projecting future revenue. Use past seasonal data to create seasonal patterns in your forecast. If you know that your marketplace generates 30% more sales in Q4, for example, you should adjust your revenue forecast accordingly. Seasonal changes could also be affected by external factors, like shifts in consumer sentiment or economic conditions.
- Marketing and Operational Assumptions: If you have plans for new marketing campaigns, product launches, or other business activities that could affect growth, factor those into your assumptions. For example, if you’re planning to invest more in digital marketing to drive traffic, you might assume that this will lead to a 10% increase in site visitors, which will, in turn, affect your sales projections.
Assumptions are powerful tools, but they need to be made carefully. It’s essential to track actual performance against these assumptions over time to adjust your projections as needed. If growth is slower than anticipated or a marketing campaign doesn’t perform as expected, you’ll need to refine your future assumptions to keep your forecast accurate.
3. Incorporate External Market Trends and Economic Factors
While historical data and internal assumptions are crucial, external market trends and economic factors can have a significant impact on your revenue projections. Marketplaces do not operate in a vacuum, and changes in the broader economy, industry developments, or consumer behavior can all affect your revenue.
- Economic Factors: Economic conditions, such as inflation, interest rates, and consumer spending, can have a significant impact on the performance of your marketplace. For example, during times of economic downturn, consumers may cut back on discretionary spending, which can lower your GMV. Alternatively, in periods of economic growth, consumers may have more disposable income to spend, leading to higher-than-expected sales. Be sure to monitor the economic landscape regularly and incorporate these factors into your revenue forecast, especially if you anticipate shifts in consumer confidence or behavior.
- Market and Industry Trends: The broader industry in which your marketplace operates also plays a role in shaping revenue projections. For example, if you run an e-commerce marketplace and there’s a rise in demand for sustainable or eco-friendly products, you may expect higher sales from these categories. Similarly, changes in consumer preferences or technological innovations could create new opportunities or challenges for your business. Stay updated on market trends by subscribing to industry reports, attending trade shows, or conducting surveys to gauge consumer sentiment.
- Competition: Your competitors’ actions can also impact your revenue forecasts. If a competitor is launching a similar platform or introducing new features that attract more customers, you may need to adjust your growth projections. Conversely, if you’re aware of a competitor’s downfall or reduced market share, this could represent an opportunity for your marketplace to grow. It’s essential to consider how competitive dynamics may influence your revenue.
- Regulatory Changes: Legal or regulatory changes can have an immediate impact on your revenue streams. For example, changes in tax laws, tariffs, or data protection regulations like GDPR could affect your marketplace’s ability to operate in certain regions, raise operational costs, or alter pricing models. Stay informed about regulatory trends that could affect your business and factor them into your forecast.
External market trends and economic factors are often more difficult to predict than internal assumptions, but keeping an eye on them can provide invaluable context for your revenue projections. Integrating this broader market intelligence into your forecasting process can help you prepare for potential disruptions or capitalize on new opportunities.
4. Refine Your Projections Over Time
A revenue forecast is not a one-time effort. To remain relevant and actionable, your projections should be continuously refined and adjusted based on new data, changing assumptions, and external factors. By regularly updating your forecast, you can keep your projections aligned with real-world developments and make more informed decisions.
- Track Actual Performance: The most effective way to refine your projections is by comparing them to actual performance. Regularly review your actual sales, traffic, conversion rates, and other key metrics. If your actual revenue deviates from your forecast, investigate the causes. Is it due to changes in consumer behavior, a marketing campaign that didn’t perform as expected, or external market conditions? Identifying why your projections didn’t match reality helps you adjust your assumptions and make your future forecasts more accurate.
- Adjust for New Information: New data, such as customer feedback, market conditions, or competitor activity, should be factored into your forecast. For instance, if you notice a significant shift in consumer preferences or if an unexpected economic event occurs (like a recession), your projections will need to reflect these changes. Incorporating this new information allows you to stay ahead of market shifts and keep your forecast aligned with the most current trends.
- Iterate Based on Insights: As you gather more historical data and track key metrics over time, your forecast should become more accurate. The more you refine your assumptions and incorporate actual performance data, the better your predictions will be. Use this iterative process to create a rolling forecast, where projections are updated regularly to reflect the most up-to-date data.
- Use Software and Automation: Many businesses now use software tools to automate revenue forecasting and refine projections in real-time. These tools can integrate directly with your marketplace’s sales, traffic, and operational data to automatically update forecasts and generate new predictions. Automation allows you to track performance seamlessly and adjust projections quickly without manual input, which can save you time and reduce the risk of human error.
The key to building a reliable revenue forecast is to stay flexible and responsive. By continually refining your projections based on real-world data, changing assumptions, and external factors, you can make more accurate predictions and better navigate the uncertainties of running a marketplace. Regularly revisiting your forecast ensures that you remain agile, ready to adapt your strategies and seize new opportunities as they arise.
Optimizing your revenue forecasting process is key to ensuring that your projections remain accurate and useful over time. By following best practices, you can improve the quality of your forecasts, better anticipate market changes, and make more informed decisions for your marketplace. These practices will help you use forecasting tools effectively and derive maximum value from them.
- Regularly update your forecast: Your marketplace is dynamic, and so are the factors that influence your revenue. Regularly updating your forecast—whether quarterly or monthly—ensures that your projections reflect the latest data and market conditions. This allows you to make adjustments quickly if things aren’t going as planned.
- Use data from multiple sources: To build a more accurate forecast, it’s important to integrate data from various sources. Don’t rely solely on internal metrics like sales volume; consider external data points such as market trends, competitor performance, and economic forecasts. Combining diverse data sources provides a fuller picture of your marketplace’s potential.
- Test different scenarios: Forecasting isn’t a one-size-fits-all exercise. By creating multiple scenarios—best-case, worst-case, and most likely-case—you can explore how different factors will impact your revenue. This helps you plan for uncertainties and be better prepared for unexpected changes in the market.
- Track and analyze deviations: After generating your revenue forecast, it’s crucial to track actual performance and analyze any deviations from your predictions. If actual sales are higher or lower than expected, identify the reasons behind the differences. This analysis helps you improve your forecasting accuracy over time and refine your assumptions.
- Incorporate feedback from all departments: Revenue forecasting isn’t just a task for the finance team. Involve other departments—such as marketing, sales, and operations—in the process to get their input on assumptions and projections. For example, marketing teams can offer insights into upcoming campaigns, while sales teams can share forecasts based on customer behavior.
- Focus on key performance indicators (KPIs): While it’s easy to get bogged down in complex data, focusing on the key performance indicators that directly impact your revenue will make the forecasting process more manageable. Prioritize metrics like GMV, take rate, conversion rate, and customer acquisition cost (CAC), as they provide the most meaningful insights into your marketplace’s financial health.
- Leverage automation: Manual forecasting is prone to errors and can be time-consuming. By leveraging automation tools and integrating your forecasting model with other business systems (such as your e-commerce platform, CRM, or analytics tools), you can streamline the process, reduce errors, and generate more timely, accurate forecasts.
- Ensure collaboration across teams: To make your revenue forecast as accurate as possible, it’s important to ensure collaboration across teams. Finance, marketing, sales, and operations all play a role in driving revenue, and each department can offer valuable insights that influence the forecast. Encourage open communication and collaboration to create a forecast that’s more comprehensive and accurate.
By following these best practices, you can optimize your revenue forecasting process, making it a powerful tool for decision-making, planning, and growth. Properly optimized forecasts allow you to anticipate changes, seize new opportunities, and make smarter decisions to grow your marketplace sustainably.
Integrating a revenue forecasting tool with your overall business strategy ensures that the data-driven insights you gain from the tool are directly aligned with your goals. By doing so, you ensure that your forecast isn’t just a financial exercise, but a strategic asset that informs every part of your business. Whether you’re making marketing decisions, setting growth targets, or adjusting operational priorities, integrating your forecast with your strategy enables a more cohesive and agile approach to business planning.
- Aligning revenue targets with business goals: Use the forecast to set realistic revenue goals that align with your overall objectives. Whether you’re aiming for growth, profitability, or market expansion, the revenue forecast can serve as a benchmark for your goals, helping you stay on track and measure progress over time.
- Informing marketing and sales strategies: The insights you gain from your revenue forecast can help shape your marketing and sales strategies. For example, if you expect a seasonal spike in sales, you can plan targeted marketing campaigns to capitalize on that growth. Similarly, understanding your projected revenue from different streams can guide your pricing and sales tactics.
- Guiding resource allocation: Your revenue forecast can help you determine where to allocate resources, whether it’s hiring more staff, investing in technology, or ramping up marketing spend. A clear understanding of your projected income ensures that you can make these decisions with confidence, knowing that they are aligned with future revenue expectations.
- Supporting investor and stakeholder communication: When you have a solid revenue forecast, you can communicate your business strategy more effectively to investors and other stakeholders. They will be able to see that you have a clear plan for growth and profitability, and that your business decisions are backed by data.
- Enabling financial planning and budgeting: By integrating your revenue forecast with financial planning and budgeting processes, you can create more accurate projections for expenses, investments, and cash flow. This ensures that your marketplace operates smoothly and remains financially healthy, even as you scale.
- Driving decision-making across departments: Revenue forecasts aren’t just for finance teams—they should inform decisions across all departments. Whether you’re deciding which products to feature, how much inventory to stock, or how to structure your commission model, having a clear revenue forecast empowers all areas of your business to make data-driven decisions.
- Tracking performance against forecast: Regularly comparing actual performance to your forecasted revenue helps you track whether you’re on target. If you’re falling short, you can quickly adjust your strategy or operational focus to get back on track. This makes your marketplace more adaptable and responsive to changes in the market.
Integrating your marketplace revenue forecasting tool with your broader business strategy allows for a more cohesive and efficient approach to achieving your goals. Rather than operating in silos, departments across your organization can use the forecast to inform their decisions and ensure that everyone is aligned with the same financial vision.
Forecasting revenue for your marketplace is a complex task that requires careful attention to data, assumptions, and external factors. Even the most sophisticated forecasting tools can produce inaccurate projections if you’re not careful. To ensure that your revenue forecasts are as accurate as possible, it’s important to avoid common mistakes that can throw off your predictions.
- Over-reliance on Historical Data: While historical data is essential for building forecasts, it can be misleading if used without considering other factors. Past performance doesn’t always predict future success, especially if market conditions, consumer behavior, or competition change. Be sure to factor in anticipated changes, such as new trends, economic shifts, or regulatory developments, instead of assuming that past trends will simply repeat.
- Failing to Adjust for Market Conditions: External factors such as economic downturns, new competition, or shifts in consumer preferences can dramatically impact your revenue. Many businesses make the mistake of ignoring these factors, relying too heavily on internal data. Be proactive in monitoring external market conditions and adjust your forecast regularly to account for these changes.
- Ignoring Customer Behavior: Revenue forecasts often focus on high-level metrics like traffic and sales volume, but overlooking customer behavior can lead to inaccurate predictions. Metrics like conversion rates, average order value, and customer retention are equally important. Make sure to incorporate behavioral data to get a more accurate picture of how your marketplace will perform.
- Over-optimistic Assumptions: It’s easy to get carried away with optimistic assumptions about growth, market potential, and customer acquisition. Overestimating growth rates or assuming that everything will go according to plan can lead to overly ambitious forecasts that are difficult to achieve. It’s important to balance optimism with caution, and consider creating multiple scenarios to account for different outcomes.
- Neglecting Seasonality: Seasonality can significantly impact revenue, especially in industries like e-commerce, travel, and entertainment. If your marketplace has peak periods during specific months or holidays, be sure to incorporate this data into your forecast. Neglecting to factor in seasonal variations can lead to unrealistic revenue projections and poor decision-making.
- Not Revisiting and Updating Your Forecast: A common mistake is treating revenue forecasting as a one-time activity. Marketplaces evolve, and so do market conditions, customer behavior, and other factors. If you only update your forecast once a year or when major changes occur, you risk making decisions based on outdated or irrelevant data. Regularly updating your forecast is key to staying on track and making timely adjustments to your strategy.
- Underestimating the Impact of Marketing and Sales: Marketing campaigns and sales efforts can have a huge impact on revenue, but it’s easy to overlook or underestimate their effectiveness. Be sure to factor in the potential impact of marketing activities like promotions, paid advertising, or influencer partnerships, as well as sales tactics like upselling or cross-selling. These efforts can significantly boost revenue, and neglecting them could lead to missed opportunities.
By staying vigilant about these common pitfalls, you can ensure that your marketplace revenue forecasting process remains grounded in reality and delivers accurate, actionable insights. Always remember to question assumptions, continuously refine your approach, and stay open to new information that may impact your forecast.
Make a one-time payment and
enjoy your template forever.
No extra costs, no strings attached,
more savings for you.
Keep your templates up-to-date
with free access to regular updates.
Related products
-
Sale!


Startup Financial Model Template
$119.00Original price was: $119.00.$79.00Current price is: $79.00. -
Sale!


Startup Profit and Loss Statement
$119.00Original price was: $119.00.$79.00Current price is: $79.00.


