
Description
Tracking and understanding customer behavior over time can be a challenge, especially when dealing with large amounts of data. Without the right tools, it’s easy to miss important patterns, make incorrect assumptions, or overlook valuable insights. Many businesses struggle with identifying which groups of users are truly engaged, which marketing efforts are effective, or where to focus retention strategies. This is where our Cohort Analysis Template comes in.
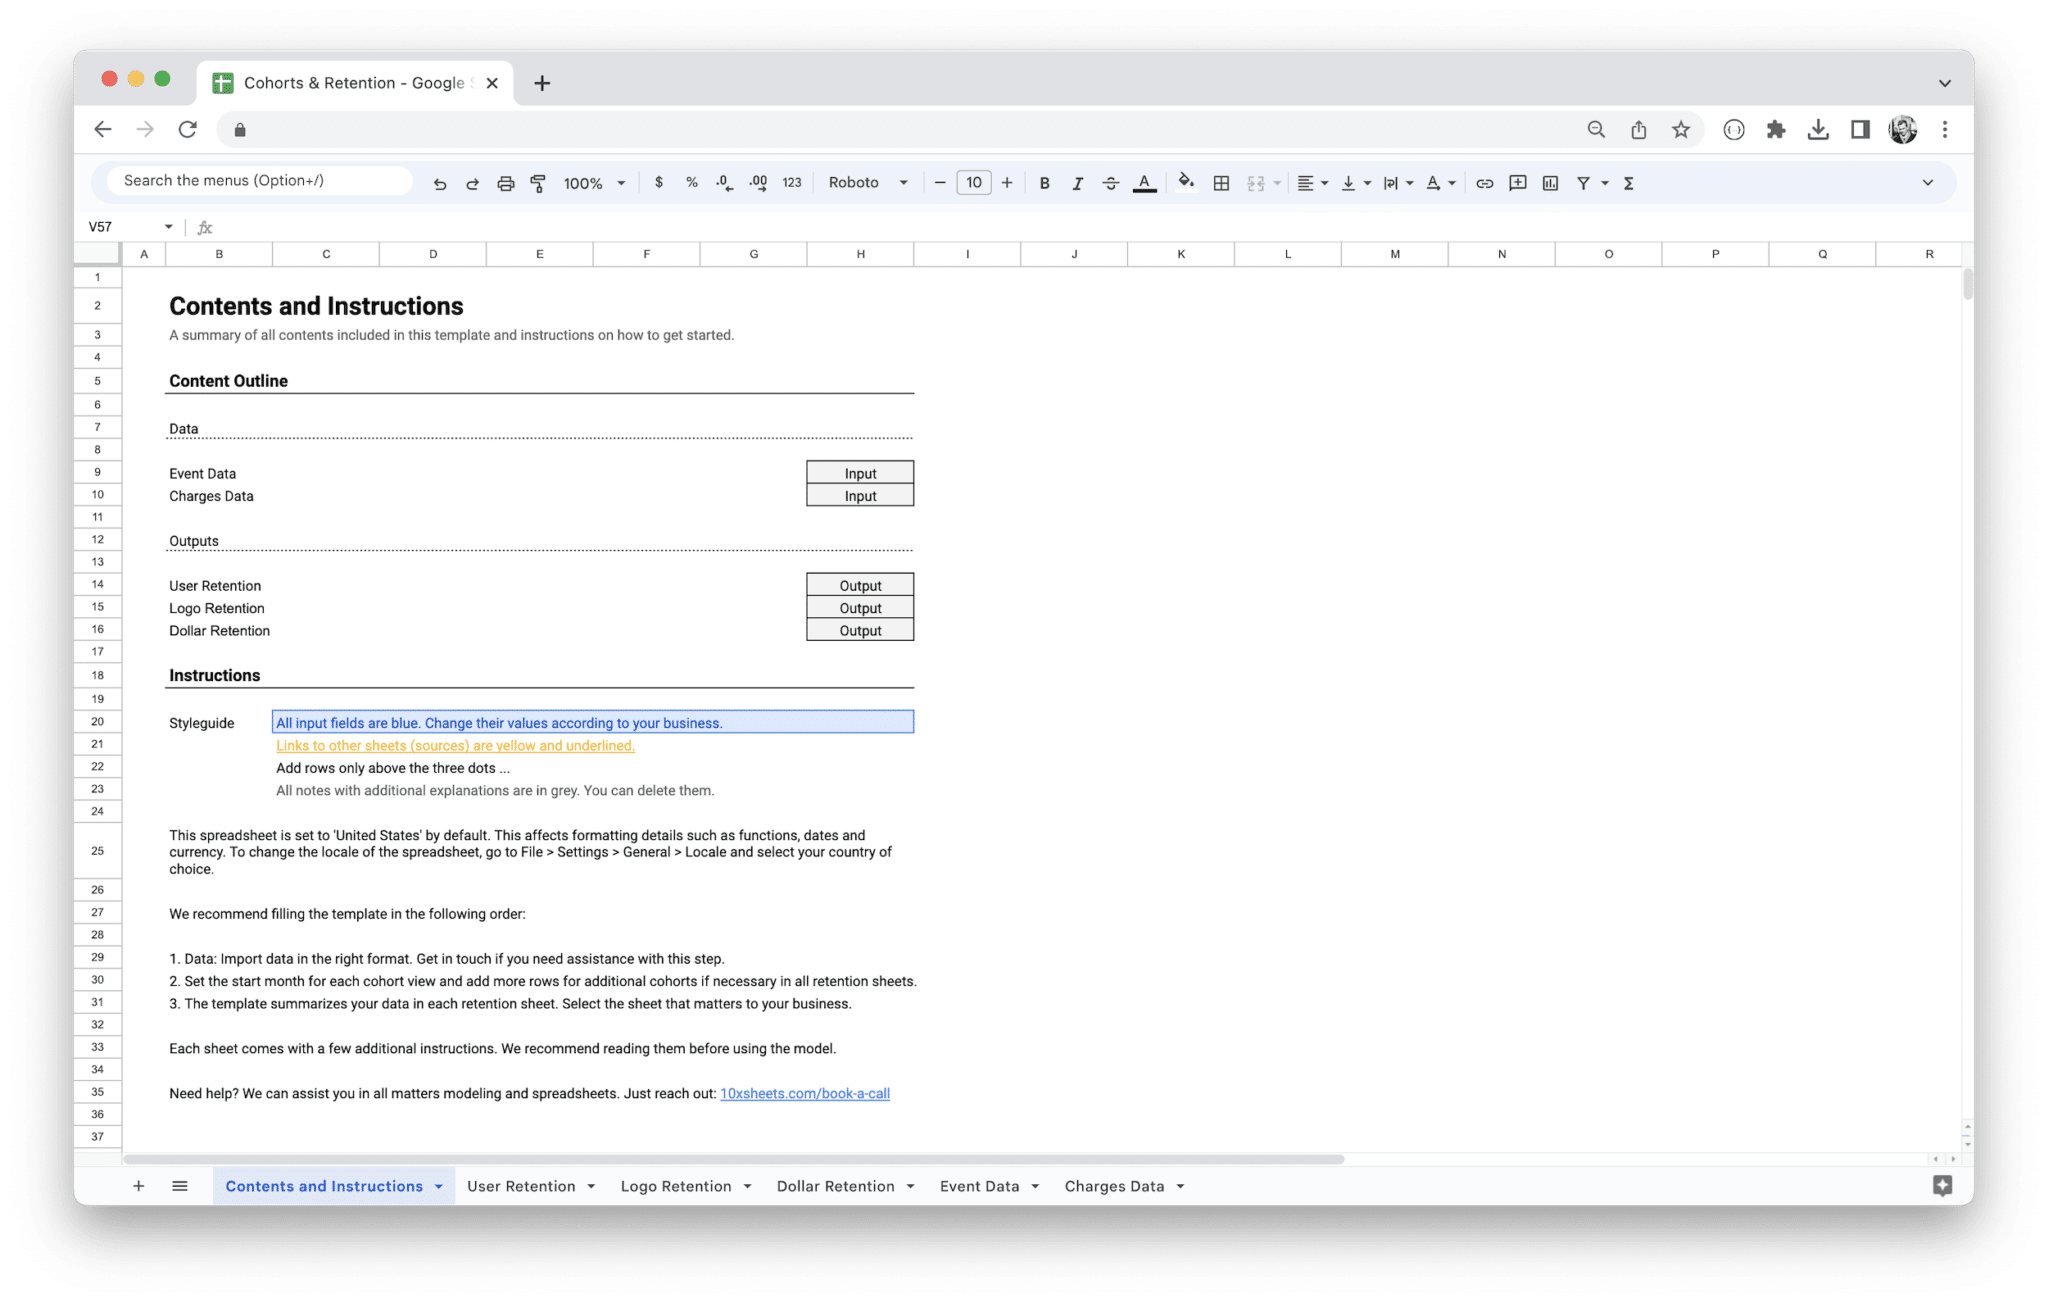
Designed to simplify and streamline your data analysis, this template helps you break down customer behavior into manageable, insightful cohorts. With it, you can group users by shared characteristics, such as sign-up date or specific actions, and track their behavior over time. The template not only saves you time but also ensures you never miss key trends that could drive smarter business decisions. By providing a clear, structured framework, you can easily compare different cohorts, measure engagement, identify retention opportunities, and tailor your marketing strategies to what actually works. It’s the perfect tool for businesses looking to make informed, data-driven decisions and ultimately boost customer retention and growth.
Cohort analysis is a powerful technique for analyzing and understanding customer behavior over time. By breaking down your data into smaller, more manageable groups (or cohorts), you can gain deeper insights into how specific segments of users interact with your product, service, or brand. This approach allows businesses to track trends, uncover issues, and optimize their strategies based on more granular data. Understanding the fundamentals of cohort analysis can unlock significant advantages when it comes to making data-driven decisions.
What is Cohort Analysis?
At its core, cohort analysis involves dividing users into distinct groups, or cohorts, based on a shared characteristic or experience within a specific timeframe. These groups can be defined by factors such as the time of acquisition, behavior, or interaction with your product. For example, you might group customers who signed up in January as one cohort and those who signed up in February as another. You can then analyze how each cohort behaves over time, comparing their retention rates, engagement levels, and other key metrics.
What makes cohort analysis different from traditional analysis methods is its ability to track changes over time within these smaller, more defined groups. Instead of looking at the average behavior of all users, cohort analysis allows you to zoom in on specific groups and observe their unique patterns, helping you identify deeper insights that would otherwise be overlooked.
Importance of Cohort Analysis in Data-Driven Decision-Making
Cohort analysis is an essential tool for businesses that want to make informed, data-driven decisions. It provides a clearer understanding of customer behavior, and allows companies to make adjustments based on these insights. By analyzing cohorts, businesses can:
- Identify long-term trends: Cohort analysis shows how customers evolve over time, allowing you to spot patterns that can help inform strategic decisions.
- Segment users more effectively: It enables businesses to segment customers in a more meaningful way, revealing different behaviors across cohorts.
- Optimize customer acquisition: Cohort analysis provides valuable insights into which acquisition channels or campaigns are most effective in terms of long-term engagement.
- Understand product usage: It helps companies see how customers use their products and whether certain features or services are driving retention.
- Improve retention strategies: By identifying cohorts with high or low retention rates, businesses can take targeted actions to improve user retention and lifetime value.
Understanding customer behavior and the factors that drive engagement and retention is crucial for making strategic decisions. Cohort analysis helps you make those decisions based on concrete data, rather than relying on gut feeling or assumptions.
Why Businesses Use Cohort Analysis for Customer Behavior Insights
Businesses leverage cohort analysis to gain a more detailed and actionable understanding of customer behavior. Here’s why it’s such a powerful tool:
- Understand user behavior over time: Cohort analysis helps you track how users behave over the long term, rather than just their initial interactions with your product.
- Optimize retention and engagement: By analyzing how cohorts perform in terms of engagement, businesses can implement strategies that increase retention and reduce churn.
- Identify the impact of changes: Cohort analysis allows businesses to isolate the impact of product changes, marketing campaigns, or seasonal trends by comparing cohorts before and after those changes are made.
- Spot trends and patterns: It helps businesses identify trends in customer behavior that might be overlooked when looking at aggregate data alone, allowing for more targeted strategies.
- Inform product development: Insights from cohort analysis can guide product decisions by revealing which features are most valuable to specific cohorts or highlighting where improvements are needed.
- Enhance customer segmentation: Cohort analysis allows businesses to break down their customer base into more relevant segments, improving how they target marketing efforts, improve user experience, and refine product offerings.
By focusing on cohort analysis, businesses can go beyond surface-level metrics and uncover deeper insights into how their customers behave over time. This enables them to make more informed decisions that drive customer satisfaction, engagement, and long-term growth.
How Cohort Analysis Helps in Identifying Trends and Patterns
Cohort analysis is an invaluable tool for uncovering trends and patterns in customer behavior that might otherwise go unnoticed. Here’s how it helps identify key insights that can guide strategic business decisions:
- Pinpoints retention trends: By tracking cohorts over time, you can identify which groups of customers are more likely to stick around, which will inform your strategies for increasing retention.
- Reveals the impact of marketing campaigns: Cohort analysis allows you to see how different marketing efforts influence customer behavior, showing whether specific campaigns are leading to longer-term engagement.
- Highlights product adoption patterns: By looking at how different cohorts interact with your product or service, you can identify patterns in how quickly and effectively users adopt new features or services.
- Exposes seasonal or time-based variations: Cohort analysis reveals how customer behavior changes based on time, helping you understand seasonal trends, shifts in demand, or the effects of external events.
- Assesses the effectiveness of onboarding: By analyzing cohorts based on when they were onboarded, you can identify which onboarding strategies lead to higher customer engagement and retention.
- Shows how customer acquisition channels perform: Cohort analysis lets you see how different user acquisition channels contribute to long-term customer value, so you can invest in the most effective sources of new customers.
- Identifies churn risks: By monitoring cohorts over time, you can quickly identify when certain groups start disengaging, allowing you to implement interventions to reduce churn.
By providing such deep insights, cohort analysis enables businesses to make more targeted decisions. Whether it’s improving retention, optimizing marketing efforts, or refining product features, cohort analysis helps you identify what works and what doesn’t, empowering you to take data-driven actions that enhance overall business performance.
Cohort analysis is a powerful technique that breaks down user data into smaller, more manageable groups for deeper analysis. By grouping users based on a shared characteristic or experience, businesses can better understand their behavior and identify trends that may not be obvious in aggregate data. Understanding what cohorts are and how they differ from other groupings is key to using this technique effectively. Let’s dive deeper into the concept of cohorts, their differences from segments, and the various types of cohorts that can be used to track user behavior.
What is a Cohort?
A cohort refers to a group of individuals who share a specific characteristic or experience within a defined time frame. These individuals are tracked together over time to observe how their behavior evolves in response to certain factors, like product changes, marketing campaigns, or seasonality. The shared experience can be anything from the time of product sign-up to specific actions they’ve taken on your platform.
For example, a cohort could consist of users who all signed up for your service during the same month, or it could be users who completed a particular action, such as making their first purchase. Cohort analysis tracks how these groups behave over time to uncover patterns and trends that may be missed when looking at overall data. By focusing on cohorts, businesses can gain insights into the long-term behavior of specific groups, rather than just observing aggregate data that includes all users.
The key to cohort analysis is that you’re not just looking at a snapshot of data, but at how these groups evolve and behave over time. By comparing the performance of different cohorts, you can uncover valuable insights into your users’ engagement, retention, and overall satisfaction with your product.
Cohort vs. Segment
While both cohorts and segments are used to group users, they differ in how they are defined and the types of insights they provide. Understanding these differences can help you choose the right approach for your analysis.
A cohort is generally defined by a shared experience or characteristic over a specific time frame. It’s all about tracking how users who shared a specific event or condition behave over time. For example, a cohort might consist of all users who signed up in January and how they interact with your product over the following months.
On the other hand, a segment is a broader classification of users based on a range of criteria. Segments might be based on demographic data (age, location, gender), behavioral data (purchase history, activity level), or engagement level (active vs. inactive users). While cohorts are usually time-bound and linked to a specific event, segments group users by shared traits or behaviors at a single point in time.
For instance, a segment could be defined as “users who are from New York” or “users who have purchased within the last 30 days,” regardless of when they first engaged with your product. Unlike cohorts, segments don’t necessarily track users over time. Segments give you a snapshot of how certain groups behave, but they don’t show how that behavior changes over time, which is where cohort analysis comes in.
Types of Cohorts
There are several different types of cohorts that businesses can use to analyze user behavior. The type of cohort you choose to analyze depends on the goals of your analysis and the questions you want to answer. Here are some common types of cohorts:
- Time-based cohorts: These cohorts are created based on when users first interacted with your product or service. For example, you might track all users who signed up in January and compare their retention or engagement rates to users who signed up in February. This is useful for tracking the impact of specific campaigns, product updates, or seasonal changes.
- Acquisition-based cohorts: These cohorts group users based on how they were acquired. For example, you could have a cohort of users who were acquired through organic search, paid ads, or referral programs. This type of cohort is useful for measuring the effectiveness of different marketing channels or understanding how the source of acquisition influences long-term user behavior.
- Behavior-based cohorts: These cohorts group users based on actions they’ve taken on your platform. For example, you might group users who completed a specific action, such as making a purchase, downloading a feature, or signing up for a newsletter. This type of cohort allows you to track the behavior of users who have engaged with your product in similar ways and see how those behaviors correlate with retention or engagement.
- Engagement-based cohorts: Engagement-based cohorts group users based on their level of interaction with your product or service. For example, you could have a cohort of users who logged in every day for the past month, compared to users who logged in just once. This type of cohort is helpful for understanding how active users differ from less engaged ones and can help identify opportunities to increase user engagement.
- Customer lifecycle cohorts: These cohorts are based on the stage of the customer journey. For example, you could track new users who are in the “acquisition” phase, active users who are in the “engagement” phase, and loyal customers who are in the “retention” phase. This type of cohort allows businesses to tailor their strategies to different stages of the customer lifecycle, optimizing the experience and increasing customer retention.
- Geographical cohorts: Users can also be grouped based on their location, which allows businesses to see how customers in different regions behave. For example, you might want to analyze cohorts of users in the U.S. versus users in Europe to see if there are differences in usage patterns or engagement levels.
- Demographic cohorts: These cohorts are based on demographic data like age, gender, income level, or other characteristics. For example, you could create cohorts of users who are 18-24 years old and compare their behavior with users in other age groups. This type of cohort is useful for understanding how different demographic groups engage with your product and can help tailor marketing efforts to specific audiences.
Each type of cohort analysis gives businesses a unique lens through which they can view their customer base. Whether you’re tracking when users sign up, how they engage with your product, or how they move through the customer lifecycle, cohorts allow you to uncover patterns and trends that drive more informed decision-making.
Using a cohort analysis template can be a game-changer when it comes to tracking, analyzing, and improving your business performance. These templates make it easier to organize your data, identify trends, and uncover insights that might otherwise go unnoticed. Instead of starting from scratch, you can take advantage of a structured framework that simplifies your workflow and ensures consistency. Below are some key benefits of using a cohort analysis template:
- Time-saving: Templates save you a tremendous amount of time by automating much of the data organization and calculation processes. You can quickly input data without having to worry about formatting, formula errors, or creating custom reports from scratch.
- Consistency and Accuracy: A well-structured template ensures that all cohorts are tracked and compared in a standardized manner. This consistency allows you to draw accurate conclusions and helps eliminate mistakes that could skew your analysis.
- Ease of Comparison: Templates often allow for side-by-side comparisons between different cohorts, enabling you to spot trends more easily. You can compare how different user groups are performing across various metrics such as retention, revenue, and engagement over time.
- Data Visualization: Many templates come with built-in charts and graphs that automatically generate visual representations of your data. This makes it much easier to identify trends, see how cohorts evolve, and communicate your findings to stakeholders without needing extra tools or custom dashboards.
- Streamlined Reporting: With everything organized in one place, cohort analysis templates make it easier to create regular reports. You can consistently track the same key metrics across different time periods, campaigns, or cohorts, ensuring that your reports stay aligned with your business objectives.
- Scalability: As your business grows, the amount of data you need to analyze also increases. A cohort analysis template allows you to scale your analysis without losing efficiency. You can add new cohorts and track a larger number of metrics without having to redesign your entire reporting system.
- Focus on Insights: Templates handle the heavy lifting, so you can focus on interpreting the data and making decisions based on what the results are showing. Instead of spending time formatting and organizing, you can dive straight into analysis, identifying what’s working and where improvements are needed.
Cohort analysis is a goldmine of insights, but to truly leverage it, you need to track and understand several key metrics that provide a clear picture of your user behavior and business performance. These metrics are your guiding lights, helping you navigate and refine your strategies. Let’s dive into the most important metrics for cohort analysis and explore why they matter in driving informed decisions.
Retention Rate and Why It Matters
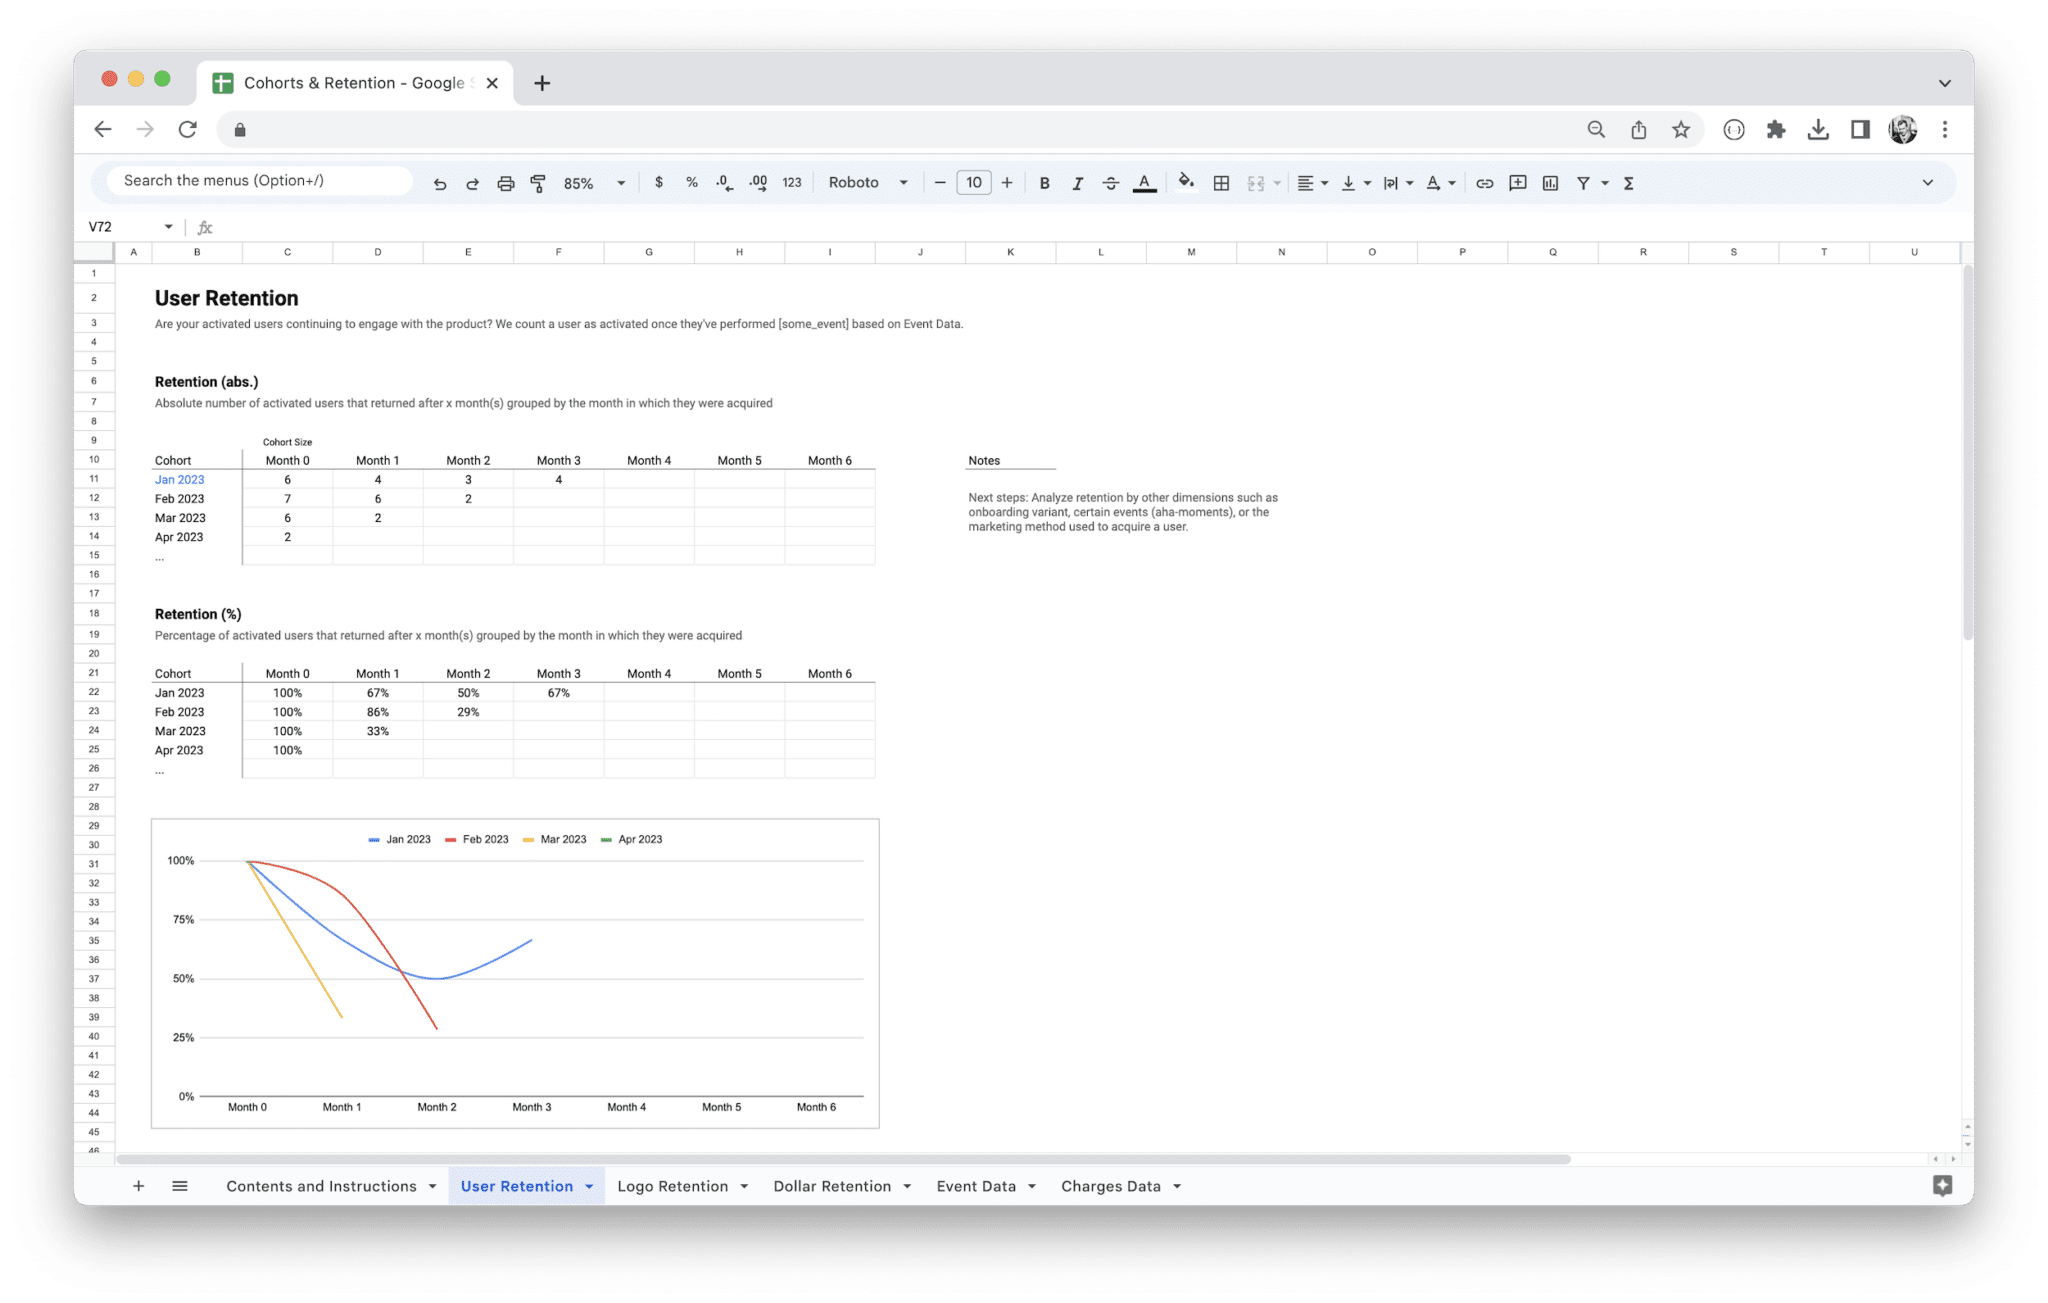
Retention rate is one of the most essential metrics for measuring how well your product or service is performing over time. It essentially tracks the percentage of customers who continue to engage with your product or service over a specific period, such as a week, month, or year. The key insight here is that retention is a direct reflection of your product’s value to your customers. If they keep coming back, it’s a good sign that your product is meeting their needs and solving their problems.
Why is retention rate so important? Because it’s far easier and more cost-effective to retain existing customers than to acquire new ones. According to various studies, the cost of acquiring a new customer can be five times more than the cost of retaining an existing one. By focusing on retention, you can maximize your revenue without dramatically increasing your marketing and sales spend.
In cohort analysis, you can compare the retention rates of different groups of users. For example, you could compare the retention rate of customers who signed up in January versus those who signed up in February. This allows you to spot trends, identify the effectiveness of different marketing campaigns, and understand how specific customer groups interact with your product.
Tracking retention across different cohorts also enables you to pinpoint where users drop off. Are there certain features or moments in the customer journey where users disengage? If so, that’s a red flag that you need to dig deeper and improve your offering. Ultimately, a high retention rate is a strong indicator of customer satisfaction and a healthy business.
Customer Lifetime Value (CLV)
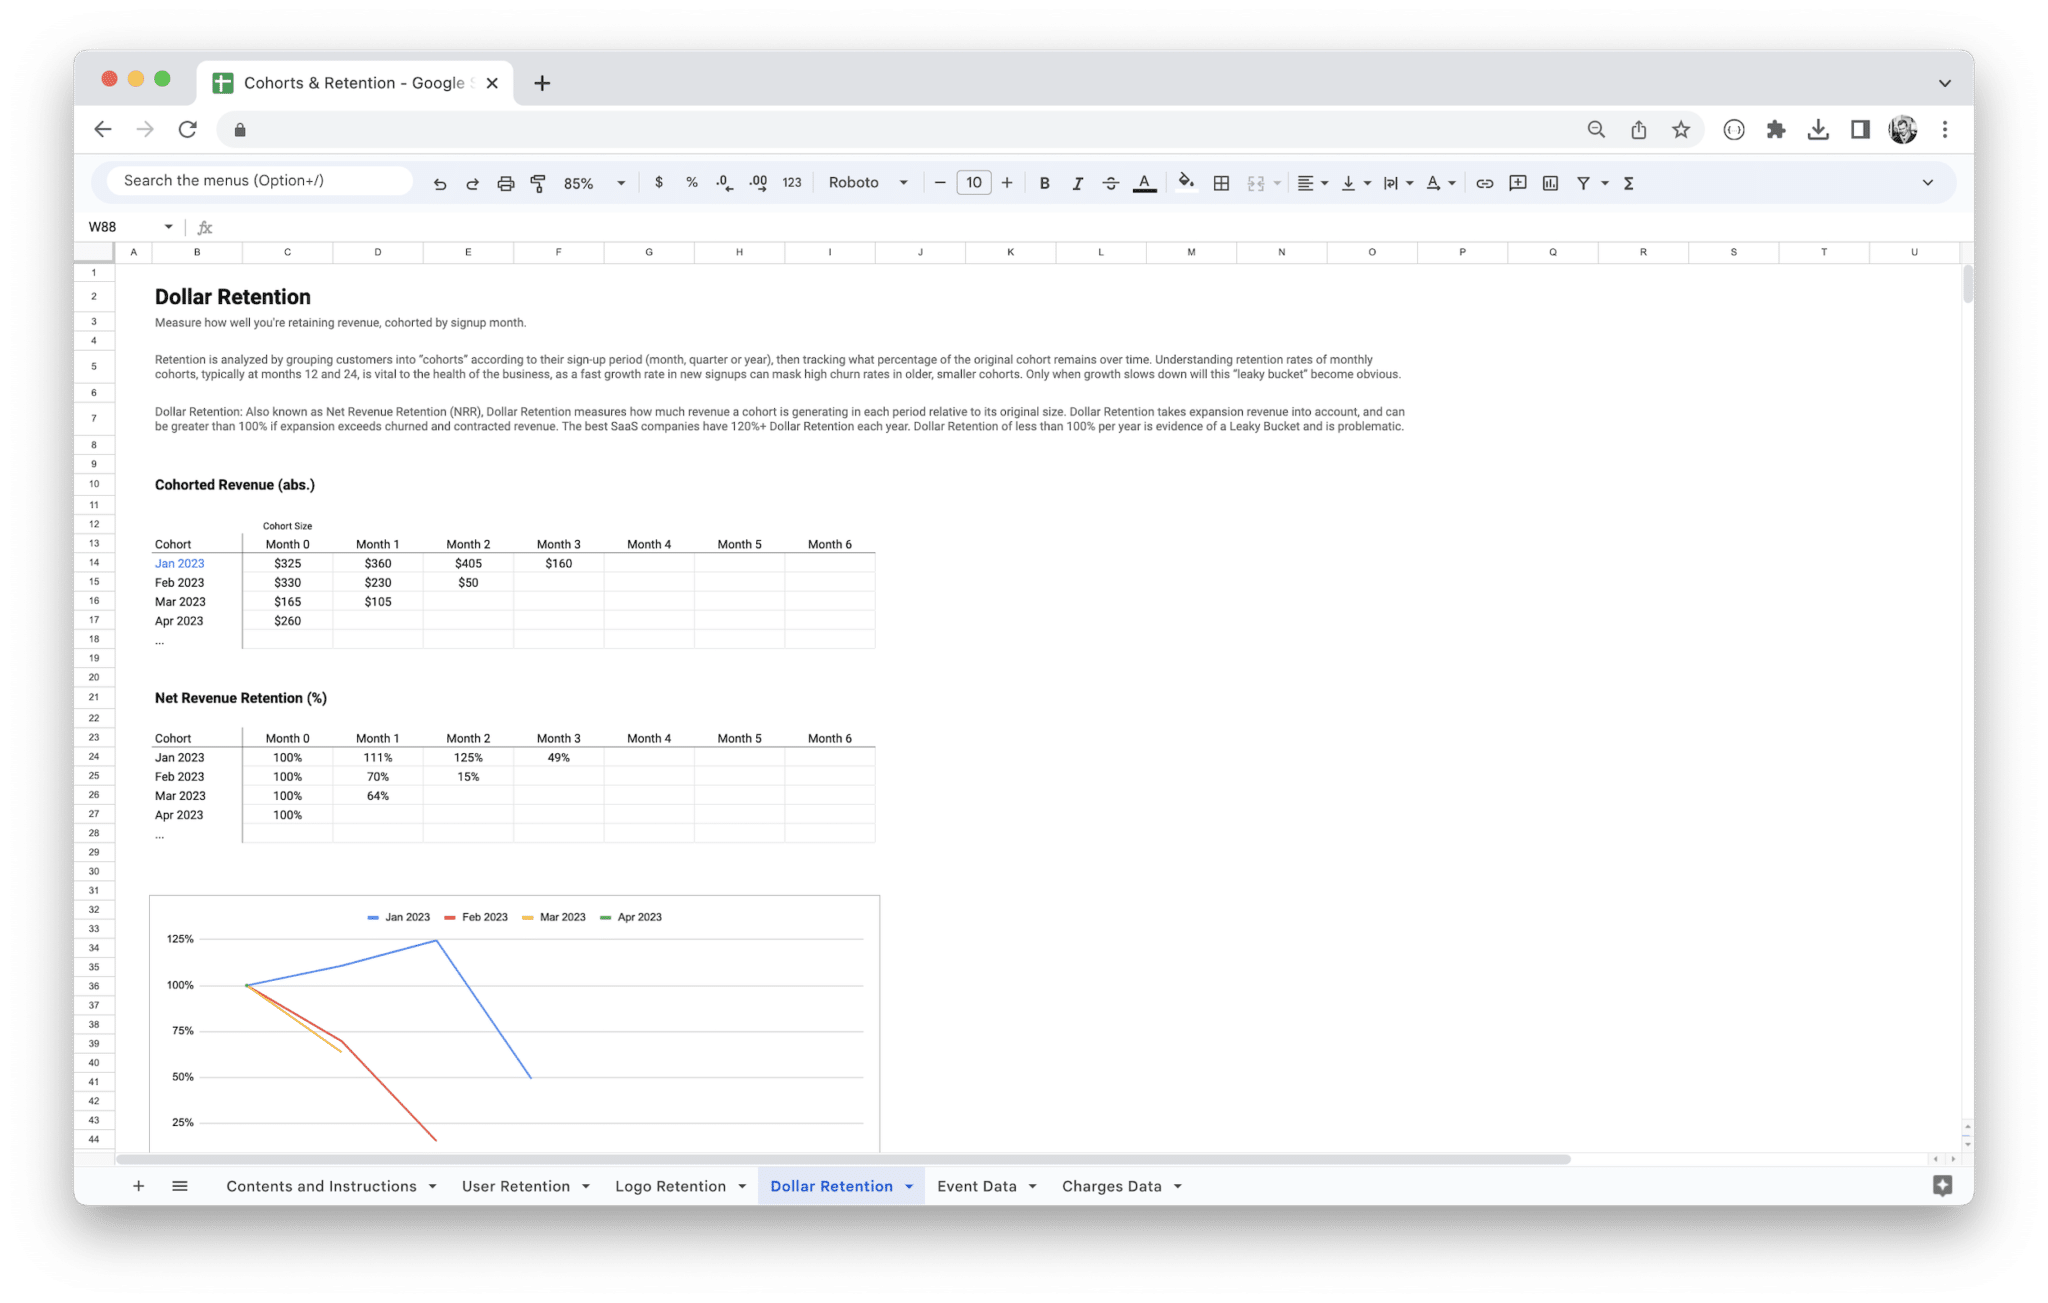
Customer Lifetime Value (CLV) is another crucial metric that helps you understand the long-term value of each customer to your business. It measures how much revenue a customer will generate during their entire relationship with your company, factoring in things like repeat purchases, upsells, and cross-sells.
Why does CLV matter in cohort analysis? By segmenting customers based on when they first interacted with your business, you can track how the CLV of different cohorts evolves over time. This can help you determine which marketing channels, products, or customer experiences yield the highest-value customers. If you find that users who signed up in January have a higher CLV than those who signed up in February, it might indicate that January users are more engaged or that they received a better onboarding experience.
Understanding CLV also helps with budgeting and forecasting. If you know that your typical customer is worth $500 over a year, and you’re spending $200 to acquire them, you can confidently calculate your ROI. Cohort analysis can help break down CLV by specific user segments or timeframes, giving you a deeper understanding of the true value of each cohort and whether your customer acquisition strategies are paying off.
Churn Rate
Churn rate, often referred to as customer attrition, tracks the percentage of customers who stop using your product or service within a certain period. A high churn rate is a major warning sign that something is wrong – whether it’s with your product, customer service, pricing, or overall user experience.
Churn rate is often seen as the opposite of retention rate. While retention focuses on keeping customers, churn highlights where you’re losing them. When combined with retention, churn data can provide powerful insights. For example, if your overall retention rate looks healthy but one cohort has a high churn rate, that could indicate a specific problem with that group. Maybe they aren’t finding value in your product, or they’re being drawn away by a competitor.
Churn rate can also highlight issues with user engagement. If customers aren’t returning or are unsubscribing after a short period, it’s likely that your product isn’t meeting their needs or that they encountered a barrier during their experience. In cohort analysis, you can break down churn by cohort to see if there’s a specific pattern or event that causes certain customers to leave.
Reducing churn should be a primary goal for any business. Focusing on cohort analysis and churn will help you identify at-risk customers early on and take proactive steps to keep them engaged. This could involve enhancing customer support, improving product features, or creating more personalized experiences that keep users invested in your product.
Engagement Rate and Frequency
Engagement rate and frequency are two metrics that provide a clear picture of how often users interact with your product or service. Engagement rate tracks the percentage of users who take specific actions or complete desired behaviors, such as logging into your app, making a purchase, or interacting with a key feature.
Frequency, on the other hand, measures how often these interactions occur. Are users coming back daily, weekly, or only when there’s a new feature release? High engagement and frequency indicate that users find your product valuable and are actively using it to meet their needs.
Engagement is closely tied to retention. If users are engaging with your product regularly, they are more likely to stick around in the long run. By tracking engagement rate and frequency by cohort, you can understand which groups of users are most involved with your product. Are users who signed up through a referral program more engaged than those who found you through paid advertising? Or do customers who made their first purchase within the first week of signing up have a higher engagement frequency than those who waited longer?
Engagement and frequency metrics are especially important for SaaS businesses or apps with subscription models. Higher engagement leads to better retention, which ultimately increases customer lifetime value and reduces churn. With cohort analysis, you can identify which features or touchpoints drive the most engagement and focus your efforts on making those elements even more compelling.
Conversion Rate by Cohort
Conversion rate by cohort tracks how many customers from each cohort take a desired action, such as making a purchase, upgrading to a paid plan, or completing a sign-up process. Understanding conversion rates at the cohort level is essential for optimizing your marketing funnel and ensuring that your efforts are targeting the right customer segments.
What makes conversion rate by cohort particularly powerful is that it enables you to measure the effectiveness of your campaigns, product changes, or user journeys for specific groups. For example, if a particular cohort of users who signed up in a specific month has a significantly higher conversion rate than other cohorts, this could suggest that a particular campaign or feature introduced during that period resonated with users.
Conversion rate also provides insight into the efficiency of your marketing and sales strategies. A low conversion rate might point to problems in your funnel, such as unclear messaging, ineffective onboarding, or poor user experience. By using cohort analysis to track conversion rates, you can pinpoint which groups of users need more attention, whether it’s through better education, more targeted marketing, or improving product features that drive action.
Analyzing conversion rates by cohort also allows you to uncover long-term trends. Do users who convert earlier in their journey tend to stay longer or engage more? Or do later-stage converters have higher lifetime values? These insights help you refine your product offering and optimize the user experience to boost conversions at every stage of the funnel.
Tracking these key metrics through cohort analysis enables you to develop a comprehensive understanding of your users’ behavior and how they interact with your product over time. By continuously monitoring and analyzing these metrics, you can identify opportunities for growth, uncover pain points, and fine-tune your strategies to maximize user engagement, retention, and overall business success.
Cohort analysis is a powerful tool, but without the right approach to using a template, it can be hard to extract the insights that drive decisions. A good cohort analysis template helps you structure your data in a way that makes trends and patterns easy to identify. Let’s explore how you can effectively use a cohort analysis template to organize your data, customize it for your needs, and analyze results for actionable insights.
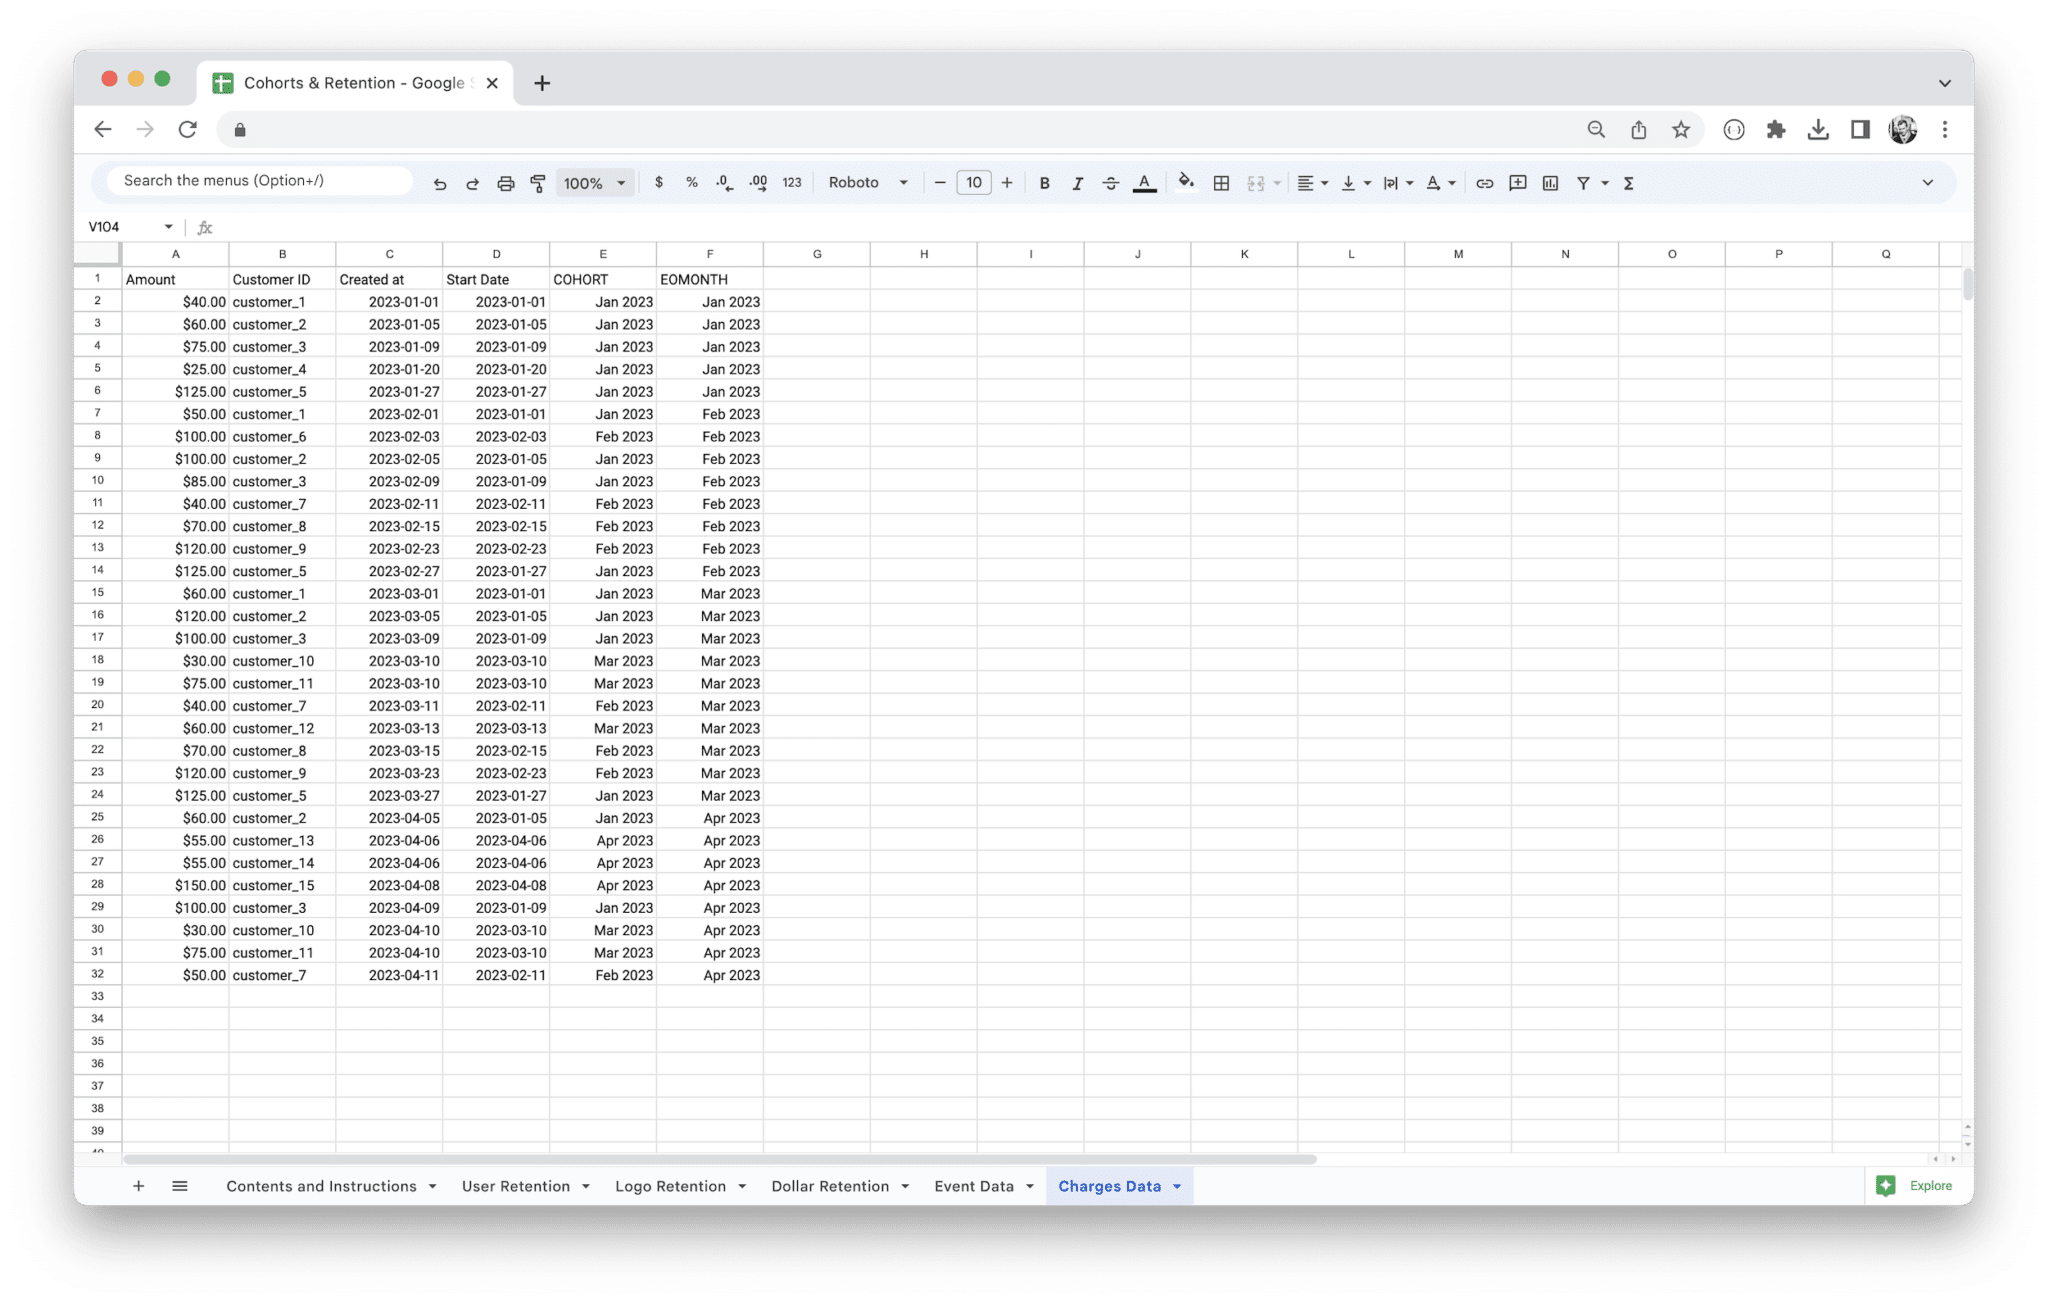
Inputting Data into the Template
The first step to using a cohort analysis template is getting your data into the template. This step is essential because it forms the foundation of your analysis. If your data isn’t correctly entered or organized, the insights you draw from it will be unreliable. So, here’s how you can effectively input your data into a template:
- Collect your data: Before you start entering anything, ensure you have all the necessary data collected. For cohort analysis, this typically includes customer acquisition data (e.g., sign-up date, source of acquisition), engagement metrics (e.g., usage frequency, login activity), and revenue metrics (e.g., purchases, subscriptions).
- Identify your cohorts: Cohorts are groups of users who share a common characteristic, such as the month they signed up or the marketing campaign they engaged with. Depending on your goals, you’ll want to define your cohorts based on a time period (e.g., monthly sign-ups), behavior (e.g., users who completed a specific action), or acquisition channel (e.g., users from a paid campaign).
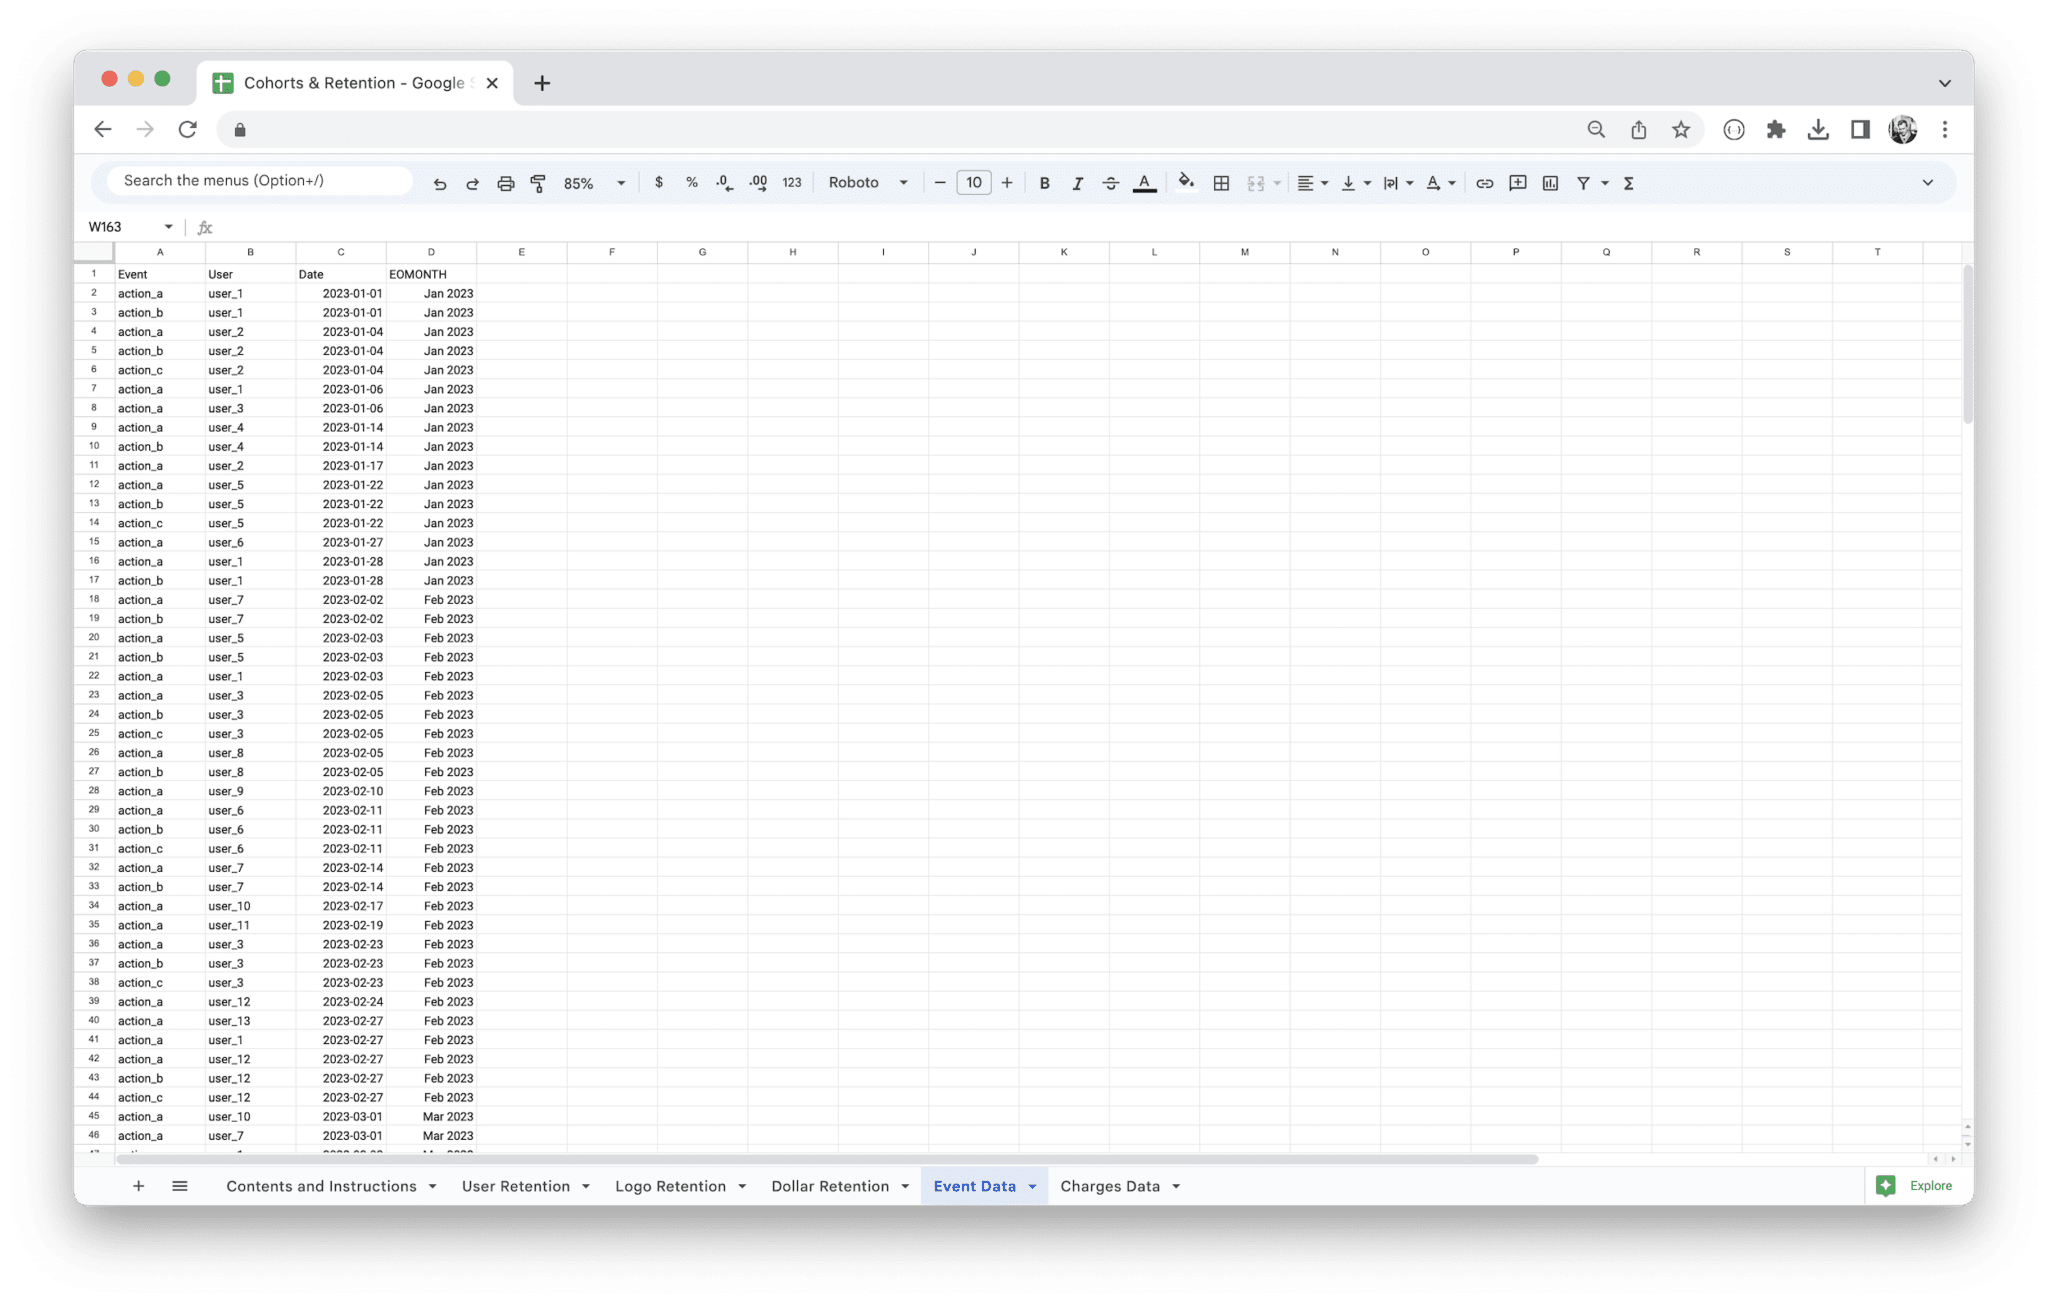
- Input the cohort data: Once you have your cohorts defined, it’s time to input the data into the template. Most cohort analysis templates are designed to let you enter user data in rows, with each row representing a different cohort. For example, each cohort might represent users who signed up in a particular month, and you’ll track metrics like retention rates, conversion rates, or churn for each month.
- Track key metrics: As you input the data, make sure to track key metrics over time. Common metrics you should include are retention, engagement frequency, churn rate, and customer lifetime value (CLV). These metrics are crucial for understanding how your cohorts behave and identifying trends.
By following this process, you’ll set up a clean and organized structure that lets you move forward with your cohort analysis. This step is the groundwork for effective analysis, so make sure it’s done with care.
Common Data Sources for Cohort Analysis
The effectiveness of your cohort analysis largely depends on the quality and sources of your data. Fortunately, there are many common data sources that you can pull from to fill your cohort analysis template. Here are some of the key sources you should consider:
- CRM Data (Customer Relationship Management): Your CRM is a goldmine for cohort analysis. It provides detailed records of customer interactions, sign-up dates, purchase history, and engagement activity. By pulling data from your CRM, you can create cohorts based on customer behaviors such as the first purchase date, product usage, or even customer service interactions. Examples of CRM systems include Salesforce, HubSpot, and Zoho.
- Google Analytics: Google Analytics can provide valuable insights into user behavior and acquisition channels. You can segment your cohorts based on when users first landed on your website, how they interacted with your pages, or how long they stayed. Google Analytics also lets you track events like sign-ups, purchases, or downloads, which is perfect for cohort analysis.
- Customer Support and Feedback Data: Your customer support tools and feedback platforms (like Zendesk, Intercom, or SurveyMonkey) can help you track how different cohorts interact with your support channels. For example, you can analyze how long it takes for customers from different cohorts to reach out for support or how often they submit feedback. This data can provide insights into customer satisfaction and potential friction points.
- E-commerce Platforms: If you run an e-commerce business, platforms like Shopify, WooCommerce, or BigCommerce will provide data on purchases, product views, and customer interactions. You can track how cohorts behave after their initial purchase, whether they make repeat purchases or churn. Tracking revenue metrics over time for each cohort allows you to understand the lifetime value of different customer segments.
- Social Media and Marketing Campaigns: Social media platforms (Facebook, Instagram, LinkedIn) and marketing campaign tools (e.g., Mailchimp, Google Ads) provide data on user acquisition and campaign performance. By pulling data from these sources, you can group users who joined during specific campaigns or social media efforts, giving you insight into how marketing initiatives impact cohort behavior.
- App Analytics (For Mobile Apps): If you offer a mobile app, tools like Mixpanel, Amplitude, or Firebase are incredibly valuable for cohort analysis. These tools allow you to track how users interact with your app, including which features they use, how often they open the app, and whether they make in-app purchases. You can segment users based on their in-app behaviors, such as how frequently they engage with key features or whether they become premium users.
By pulling data from these common sources, you’ll ensure that you have a robust and comprehensive set of information to input into your cohort analysis template. The more granular and accurate your data, the more useful your analysis will be.
Customizing the Template to Suit Your Specific Needs
One of the biggest advantages of using a cohort analysis template is its flexibility. While templates often come with predefined structures, you can (and should) customize them to fit your specific needs. Not all businesses are the same, and neither are their cohort analysis requirements. Here’s how you can tailor your template to make it truly work for you:
- Modify cohort definitions: Depending on your objectives, you may need to tweak how you define cohorts. For example, if you’re running a subscription service, you might create cohorts based on the first month a user subscribed, rather than when they first visited your site. If you’re tracking campaign performance, your cohorts might be based on the acquisition channel (e.g., email sign-ups, Facebook ads, organic traffic).
- Add or remove columns for metrics: Cohort analysis can track many different metrics, but not all of them will be relevant to your business. Customize your template to track the key metrics that matter most for your business goals. For example, you might want to track specific engagement behaviors (e.g., clicks, purchases, usage frequency) or long-term metrics like customer lifetime value (CLV) or net promoter score (NPS). If a metric isn’t useful, remove it. If you need a new one, add it.
- Include timeframes that suit your business: The time intervals you use for cohort analysis can vary depending on your business model. For instance, an e-commerce company might look at daily or weekly cohorts, while a SaaS business might focus on monthly or quarterly cohorts. Adjust your template to reflect the appropriate time frames for your analysis, whether you’re tracking short-term engagement or long-term trends.
- Incorporate your goals into the template: Every business has different goals. Are you focused on reducing churn, increasing engagement, or boosting customer lifetime value? Tailor your cohort analysis template to reflect these priorities by adding columns that track progress toward your specific objectives. If you are running a seasonal campaign, for example, make sure the template allows you to compare cohorts from different seasons or marketing pushes.
Customizing your cohort analysis template helps you get more relevant and actionable insights that are specific to your business needs. With a little adjustment, you can ensure that the template works for you and gives you data you can actually use.
Analyzing Cohort Data Effectively Using the Template
Once your data is in the template and customized to your needs, the next step is analysis. This is where the real value of cohort analysis shines. By examining the data carefully, you can identify patterns, uncover pain points, and discover opportunities that may not have been obvious at first glance.
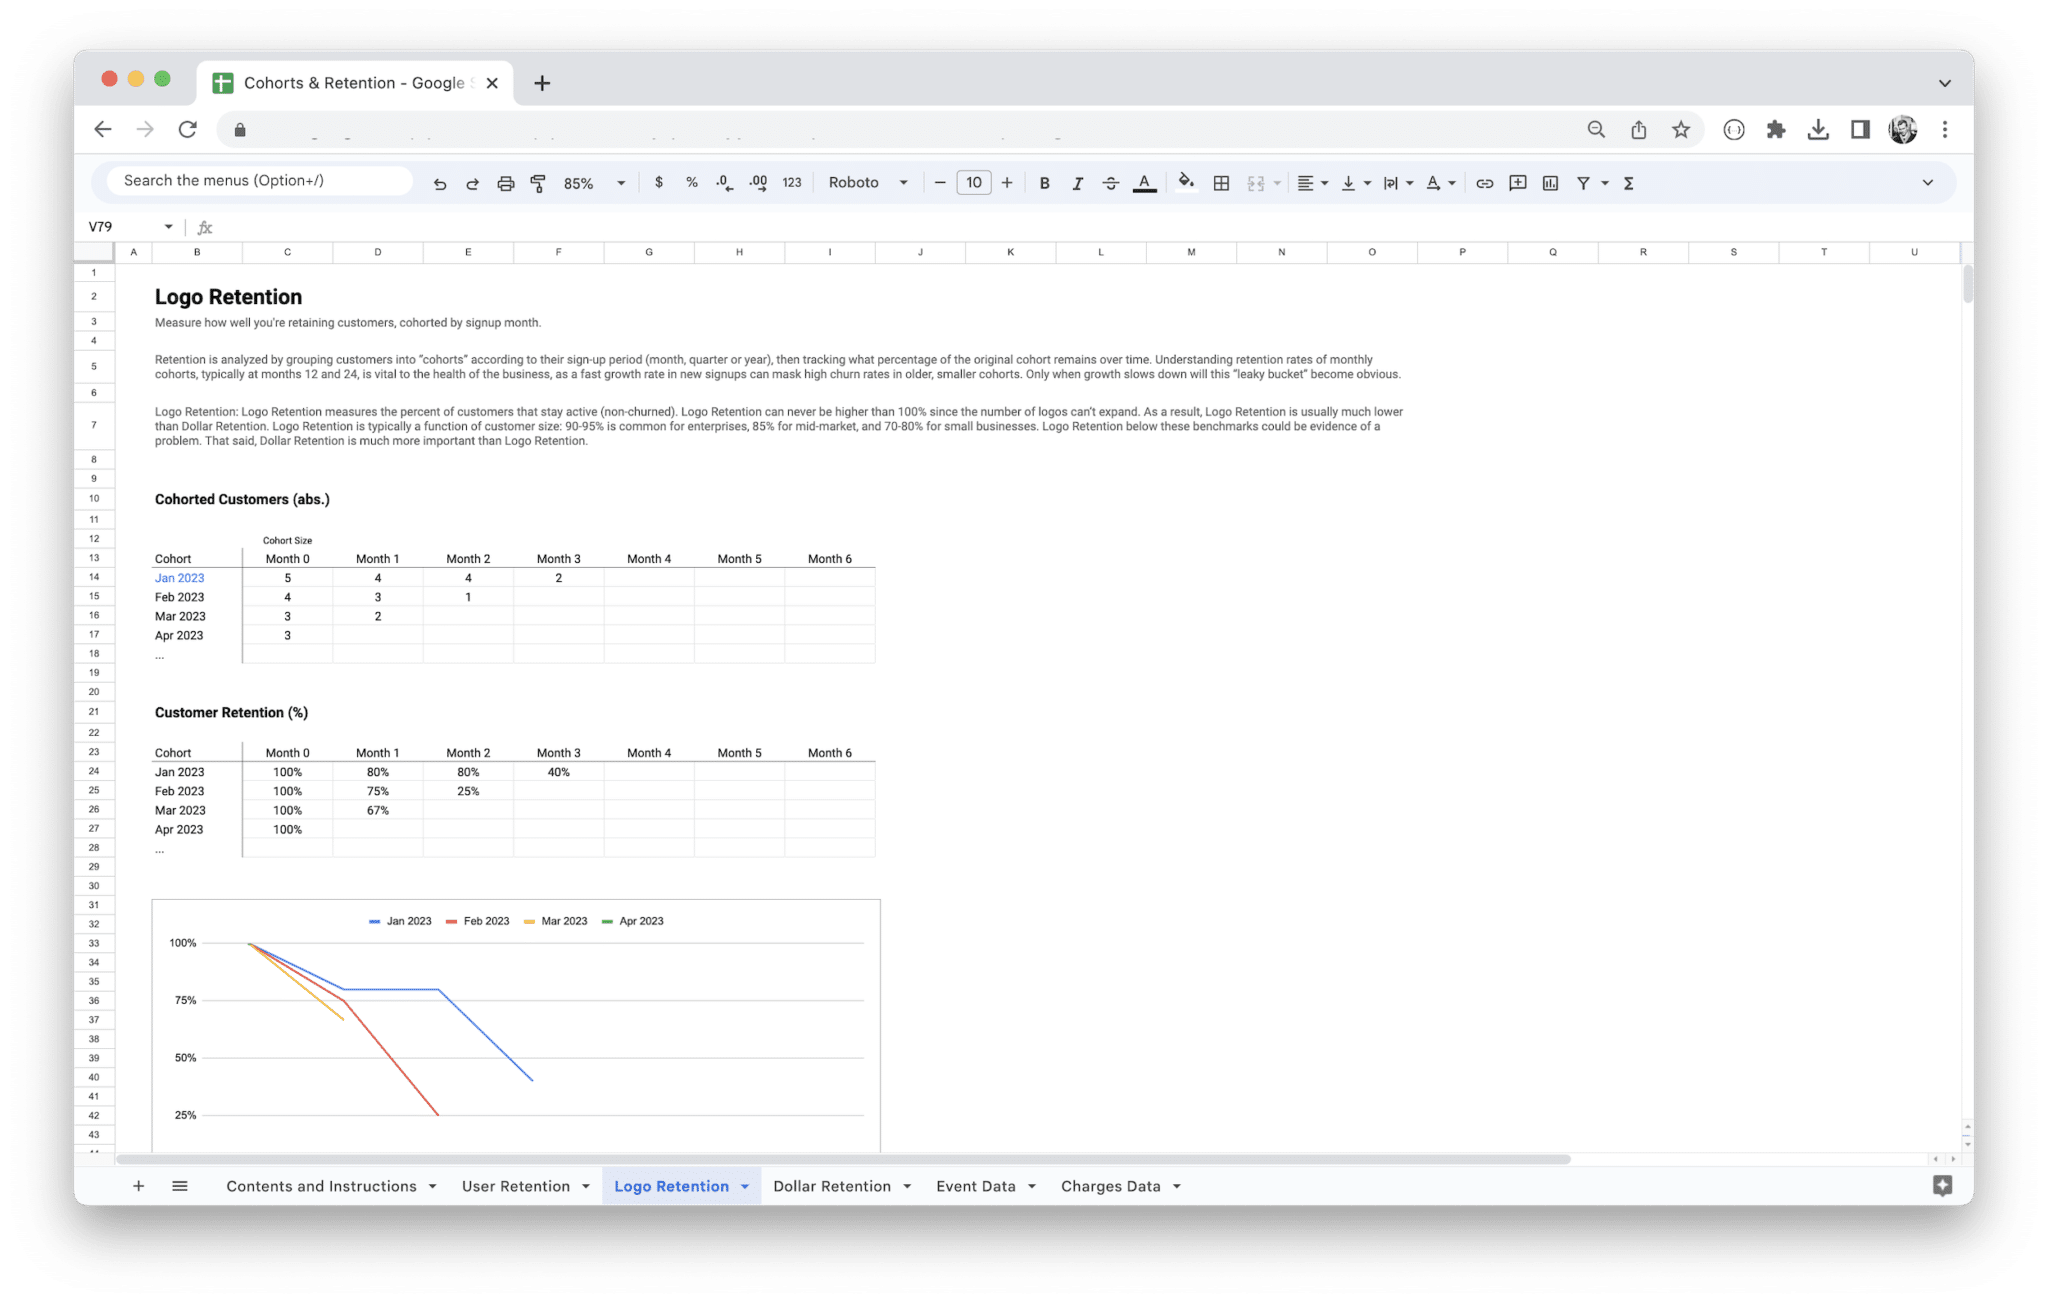
- Look for trends over time: One of the most useful aspects of cohort analysis is spotting trends in how cohorts behave over time. For example, you might notice that users who signed up in January have a higher retention rate at the 6-month mark compared to users who signed up in March. This could suggest that something you did in January—perhaps a promotional campaign, a new feature, or better onboarding—had a lasting positive impact.
- Compare different cohorts: Another key part of analyzing cohort data is comparing cohorts against each other. Look at how different cohorts perform in terms of retention, engagement, and revenue. Are users acquired via organic search more engaged than those who come through paid ads? Or do users who sign up in the first quarter have a higher CLV than those who sign up later? These comparisons give you valuable insights into how different groups interact with your business and where to focus your resources.
- Track performance against your goals: As you analyze your cohort data, check how each cohort aligns with your goals. If your goal is to reduce churn, look for cohorts that have lower churn rates and identify the factors contributing to their success. If you aim to increase lifetime value, focus on cohorts with high CLV and analyze what made them valuable. By tracking these metrics, you’ll not only understand past behavior but also make more informed decisions moving forward.
- Identify pain points and opportunities: Cohort analysis is an excellent tool for uncovering both challenges and opportunities. For example, if you see that a particular cohort has a high churn rate after three months, dig deeper into what might be causing this. Was there a product update that negatively impacted the experience? Did customers encounter difficulties in the onboarding process? Similarly, if you spot a cohort with a strong retention rate and high engagement, explore what worked well and see how you can replicate it across other cohorts.
- Refine your strategy: The insights you gain from cohort analysis should feed directly into your business strategy. If a cohort is underperforming, think about how you can improve the experience for that group. Maybe you need to tweak your onboarding, offer personalized support, or introduce new features. Similarly, use the insights from high-performing cohorts to double down on the strategies that are working.
Analyzing cohort data is an ongoing process. By continually examining how different cohorts behave and adjusting your strategies accordingly, you can continuously improve your product, marketing, and customer experience, leading to better retention, higher engagement, and ultimately, increased revenue.
To get the most out of your cohort analysis, it’s essential to follow some best practices that will ensure your data is accurate, your insights are actionable, and your overall process is as effective as possible. Implementing these best practices will allow you to uncover deeper insights, optimize your strategies, and continuously improve your business performance. Here are the best practices to follow:
- Define clear cohort criteria: Be specific about how you define your cohorts, whether it’s by acquisition date, behavior, or other characteristics. Clear and consistent definitions make your analysis more reliable and easier to interpret.
- Use multiple time frames: Track your cohorts over various time periods, such as weekly, monthly, and quarterly. This allows you to capture both short-term trends and long-term patterns, providing a more complete picture of customer behavior.
- Track a variety of metrics: Focus on key performance metrics like retention, engagement, lifetime value, and churn rate. Don’t just look at one metric in isolation, as multiple metrics can offer a more nuanced understanding of cohort performance.
- Segment by relevant factors: Segment your cohorts by relevant factors like acquisition channel, product usage, or geographic location to gain deeper insights. This segmentation will allow you to see how different user groups behave and what specific factors are influencing their actions.
- Regularly update cohorts: Don’t treat your cohorts as static data points. Regularly update them as new customers or users come on board and as behaviors evolve. This helps keep your analysis relevant and timely.
- A/B test alongside cohort analysis: Use A/B testing in conjunction with cohort analysis to see how different changes—such as product updates or marketing campaigns—affect various cohorts. This will help you understand what’s driving differences in behavior and performance.
- Focus on actionable insights: The ultimate goal of cohort analysis is to make data-driven decisions. Don’t get lost in the numbers. Identify key insights that can help improve user experience, optimize marketing efforts, or reduce churn. Use these insights to inform your strategies.
- Visualize your data: Incorporate charts and graphs to help you spot trends and patterns more easily. Visualization can be a great tool to present data to stakeholders and highlight important takeaways that may not be immediately obvious in raw data.
Cohort analysis is a powerful tool for understanding user behavior and making data-driven decisions. However, once you’re comfortable with the basics, you can take your analysis to the next level by applying more advanced techniques. These advanced methods allow you to leverage cohort analysis for deeper insights, better forecasts, and more targeted strategies. Let’s explore some of these advanced techniques that can help you refine your approach and gain more value from your data.
Using Cohort Analysis for Predictive Modeling
Predictive modeling involves using historical data to make forecasts about future behavior. When applied to cohort analysis, predictive modeling can be a game-changer. Instead of just looking at past trends, you can use your cohort data to predict how future cohorts will behave, helping you make proactive business decisions.
The beauty of predictive modeling in cohort analysis lies in its ability to forecast customer retention, lifetime value, or even churn rates based on past patterns. By identifying trends in how cohorts behave over time, you can build models that predict the likelihood of a user staying engaged or converting. For example, if you notice that users who sign up in January tend to stay active for at least six months, you could use that data to predict the engagement levels of future cohorts who sign up during similar periods.
To use cohort analysis for predictive modeling, you’ll need to follow a few key steps:
- Collect and clean data: Ensure you have a large enough dataset that includes historical cohort data, such as user acquisition date, retention metrics, engagement frequency, or CLV. The more data you have, the more accurate your predictions will be.
- Identify patterns: Look for trends in past cohorts that are predictive of future behavior. For example, do users who sign up after a particular campaign show higher engagement? Do users who complete onboarding within a certain time frame tend to stick around longer? These patterns can serve as the foundation for your predictive models.
- Build a predictive model: Using statistical or machine learning techniques, you can create a model that forecasts future cohort behavior. Tools like Python, R, or platforms like Google Analytics and Mixpanel offer predictive analytics capabilities. These models can be based on various factors like user demographics, campaign types, or engagement patterns.
- Test and refine: Predictive models are not set-and-forget tools. After creating your model, you should continuously test it against actual outcomes to assess its accuracy. Over time, as new data comes in, you can refine your model to improve predictions.
Predictive modeling helps you go beyond looking at how cohorts perform in the past. It equips you to anticipate what’s coming next, enabling you to make more informed decisions about customer acquisition, retention strategies, and product development. By leveraging cohort analysis in this way, you can optimize marketing spend, improve customer retention, and forecast revenue with greater accuracy.
Segmenting by Customer Lifecycle Stages
Customer lifecycle stages are the different phases a customer goes through while interacting with your business, from initial awareness to long-term loyalty. Understanding where each customer is in their lifecycle can help you deliver more personalized experiences, optimize your sales and marketing strategies, and improve customer retention.
By segmenting your cohorts based on lifecycle stages, you can gain valuable insights into how users interact with your product at different points of their journey. For instance, a new user’s experience will likely differ significantly from a user who has been using your product for a year. By tracking these lifecycle stages, you can identify specific needs or pain points unique to each stage and tailor your approach accordingly.
The key stages of the customer lifecycle are typically:
- Acquisition: This is the phase when a user first becomes aware of your product and signs up or makes an initial purchase. Segmenting this cohort can help you understand how customers acquired through different channels (organic, paid, referral) perform over time. Are customers who came from a referral program more likely to convert or stay longer than those who found you through paid ads?
- Activation: This phase refers to when customers start experiencing the core value of your product. In SaaS, for example, this could be the moment they first use a key feature or complete onboarding. By analyzing this cohort, you can assess how quickly users move from sign-up to activation and identify obstacles that might be preventing them from fully adopting your product.
- Retention: Once customers are activated, the goal is to keep them coming back. Cohorts in the retention stage help you track how often users engage with your product, whether they renew subscriptions, or if they churn. Analyzing retention cohorts reveals opportunities to improve engagement, offer relevant incentives, or personalize the user experience.
- Revenue/Monetization: For businesses that rely on upsells, subscriptions, or recurring revenue, the revenue stage is critical. Cohorts in this stage are those who are generating revenue for your business. By segmenting these users, you can analyze their spending behavior, understand what drives purchases, and optimize pricing strategies.
- Loyalty: Loyal customers are those who have used your product or service for a long time and continue to engage at a high level. These cohorts are incredibly valuable because they often act as brand ambassadors and help drive new customer acquisition through word of mouth. By analyzing this cohort, you can learn what keeps them loyal and replicate these factors for other users.
Segmenting cohorts based on lifecycle stages helps you identify which part of the journey requires more attention. Are you struggling to convert new sign-ups into active users? Or maybe your retention rate drops significantly after users hit the activation stage? By pinpointing where the breakdown occurs, you can implement targeted strategies to improve those stages, whether it’s by enhancing the onboarding process, offering targeted incentives, or nurturing long-term relationships.
This segmentation strategy also allows you to personalize your messaging and marketing efforts. For example, users in the activation stage may benefit from educational content, while those in the retention stage might appreciate loyalty rewards or re-engagement campaigns.
Combining Cohort Analysis with Other Analytics Tools for Deeper Insights
Cohort analysis is incredibly powerful on its own, but when combined with other analytics tools, its value increases exponentially. By integrating cohort analysis with other platforms or methodologies, you can gain a more holistic view of your customers and make more informed decisions. Let’s explore how combining cohort analysis with other analytics tools can deepen your insights and lead to better strategies.
- A/B Testing: By combining cohort analysis with A/B testing tools (like Optimizely or Google Optimize), you can see how different variations of your product or marketing efforts perform across different cohorts. For example, you might test different onboarding flows to see which one results in better long-term retention for specific cohorts. This allows you to make data-driven decisions about which changes to implement.
- User Feedback and Surveys: Incorporating customer feedback through surveys or tools like Intercom, SurveyMonkey, or Qualtrics can enrich your cohort analysis. By asking users for feedback at different stages of their journey, you can understand the “why” behind their behaviors. Do users from a certain cohort feel that your product lacks a key feature? Or do they find the sign-up process confusing? This qualitative data complements the quantitative data in your cohort analysis, giving you a full picture of user experience.
- Customer Segmentation Tools: Using advanced customer segmentation tools like Segment, Kissmetrics, or Amplitude alongside cohort analysis allows you to analyze different customer attributes (e.g., demographics, psychographics, or behavior). Combining these tools can reveal how different customer types interact with your product at various stages of the lifecycle. For instance, you might discover that users in a certain geographic region engage with your product differently than those in other regions, or that certain customer personas are more likely to churn.
- Marketing Automation Platforms: Platforms like HubSpot, Marketo, or Mailchimp offer deep insights into customer journeys, and when integrated with cohort analysis, they provide a clearer understanding of how marketing campaigns influence different cohorts. You can track email open rates, click-through rates, and other engagement metrics for specific cohorts and tie those actions to retention or conversion rates.
- CRM Data: Integrating your CRM system with cohort analysis adds another layer of depth. Tools like Salesforce or Zoho allow you to track customer interactions over time, including sales, support tickets, and product usage. This data can help you understand how customer service interactions, upsells, or personalized outreach impact cohort performance.
- Product Analytics Tools: If you use tools like Mixpanel, Amplitude, or Pendo, you can track how users interact with specific features in your product. Combining these insights with cohort analysis allows you to see which features drive engagement and retention for specific cohorts. For instance, if you’re tracking user behavior for a SaaS product, you might find that cohorts who use a particular feature tend to stay engaged longer or convert to paying customers at a higher rate.
By combining cohort analysis with these additional tools, you can uncover deeper insights and take more effective action. For example, if you’re seeing a drop in retention among a specific cohort, combining cohort data with A/B testing results might reveal that a recent product update negatively impacted their experience. Alternatively, using CRM data might show that a lack of follow-up communication contributed to the drop-off. Combining data from multiple sources provides a more complete picture, helping you make more targeted improvements to your product, marketing, and customer experience.
Mastering these advanced cohort analysis techniques allows you to unlock new insights, make more accurate predictions, and create more personalized experiences for your customers. Whether you’re using predictive modeling to forecast future behaviors, segmenting by customer lifecycle stages to optimize retention, or combining data from multiple tools for a holistic view, these techniques give you the power to take your cohort analysis to the next level.
Cohort analysis is a powerful tool, but there are several pitfalls that can hinder the accuracy of your insights or mislead you into drawing the wrong conclusions. Being aware of these common mistakes can help you avoid them and ensure your cohort analysis delivers the results you need. Here are some mistakes to watch out for:
- Defining cohorts too broadly: A common mistake is defining cohorts in a way that’s too broad, which can obscure meaningful differences. Be specific in how you define your cohorts so that each one reflects a distinct group with unique characteristics or behaviors.
- Not tracking enough metrics: Relying on just one or two metrics can give you a skewed perspective of your cohorts. Make sure you’re tracking a variety of key metrics, like retention, churn, engagement, and lifetime value, to get a well-rounded view of user behavior.
- Failing to update cohorts regularly: Cohorts should be dynamic, not static. If you neglect to update your cohorts as new users sign up or behavior changes, your analysis will become outdated and less relevant over time.
- Ignoring external factors: Sometimes, cohort behavior can be influenced by factors outside your control, such as seasonality, market changes, or external events. Failing to account for these factors can lead to misinterpretations of your data.
- Overcomplicating the analysis: While cohort analysis offers powerful insights, it can be easy to overcomplicate things. Don’t drown in unnecessary details or metrics. Focus on the key factors that drive your business performance and keep your analysis simple and actionable.
- Assuming causality without testing: Cohort analysis shows correlations, but it doesn’t automatically establish cause and effect. Avoid jumping to conclusions about what’s driving certain behaviors. Use additional tools, like A/B testing or customer feedback, to validate your findings.
- Not comparing cohorts to baseline data: Without comparing cohort performance to baseline data, such as historical trends or industry standards, it can be hard to judge whether your results are genuinely positive or negative. Always contextualize your findings to ensure you’re seeing real, actionable trends.
- Neglecting smaller cohorts: Small cohorts might not seem as important, but they can provide insights into niche user groups or specific behaviors. Don’t overlook these smaller datasets, as they can still have valuable information that larger cohorts might miss.
By keeping these best practices and common mistakes in mind, you can ensure that your cohort analysis is both accurate and actionable. Implementing these strategies will help you uncover the insights that will allow you to optimize your product, improve user engagement, and drive business growth.
Make a one-time payment and
enjoy your template forever.
No extra costs, no strings attached,
more savings for you.
Keep your templates up-to-date
with free access to regular updates.
Related products
-
Sale!


SaaS Profit and Loss Statement
$119.00Original price was: $119.00.$79.00Current price is: $79.00. -
Sale!


E-Commerce Profit and Loss Statement
$119.00Original price was: $119.00.$79.00Current price is: $79.00. -
Sale!


Marketplace Profit and Loss Statement
$119.00Original price was: $119.00.$79.00Current price is: $79.00.


