
- What is Google Sheets?
- How to Get Started with Google Sheets?
- Basic Google Sheets Functions and Formulas
- How to Format Your Google Sheet?
- Advanced Google Sheets Formulas and Functions
- Organizing and Analyzing Google Sheets Data
- Google Sheets Collaboration Features
- Google Sheets Automation and Integration
- Google Sheets Best Practices for Efficiency
- Conclusion
Are you looking for an easy way to manage data, perform calculations, and collaborate with others in real-time? Google Sheets is the perfect tool for the job. Whether you’re organizing a budget, tracking a project, or analyzing data, this free, cloud-based spreadsheet application has everything you need to get the job done efficiently. With its powerful features, including built-in functions, real-time collaboration, and seamless integration with other Google services, Google Sheets makes working with data simpler and more flexible than ever.
This guide will walk you through everything you need to know, from getting started with the basics to mastering advanced features, so you can make the most of what Google Sheets has to offer.
What is Google Sheets?
Google Sheets is a powerful cloud-based spreadsheet application that is part of Google Workspace (formerly G Suite). It allows users to create, edit, and collaborate on spreadsheets in real-time, making it an essential tool for personal, business, and educational use. Whether you’re analyzing data, tracking progress, or creating complex reports, Google Sheets offers a range of features that simplify data management and improve workflow efficiency.
Unlike traditional spreadsheet software like Microsoft Excel, Google Sheets is entirely web-based, meaning you can access your documents from any device with internet access. This cloud-based system ensures your data is always up to date and securely stored. Moreover, because it’s integrated with other Google services, such as Google Drive and Google Forms, it’s incredibly versatile and easy to share with others.
Benefits of Using Google Sheets Over Other Spreadsheet Software
- Real-Time Collaboration: Multiple users can work on a sheet simultaneously, seeing changes as they happen. This is ideal for team projects or when multiple stakeholders need access to the same data.
- Cloud-Based: Your work is automatically saved in Google Drive, eliminating the risk of losing data due to system crashes or forgotten saves.
- Cross-Device Accessibility: Google Sheets can be accessed from any device, including desktops, tablets, and smartphones. All you need is an internet connection.
- Free to Use: Google Sheets is completely free for personal use, which is a major advantage over paid spreadsheet software like Microsoft Excel.
- Easy Sharing and Permissions: You can easily share your sheet with others by simply sending a link or inviting them by email. Permissions can be customized to control whether others can edit, comment, or just view the document.
- Automatic Updates: Google Sheets automatically updates its features and fixes bugs without the need for manual updates, ensuring you’re always using the latest version.
- Integration with Google Workspace: Google Sheets integrates smoothly with other Google tools like Google Forms, Google Docs, Google Slides, and Google Analytics, making it ideal for projects that span across multiple platforms.
Key Features to Know Before You Begin
- Cloud Storage: All your documents are stored in Google Drive, ensuring they are accessible from anywhere and can be easily shared with others.
- Real-Time Collaboration: You can invite collaborators to edit your sheet in real-time, making team projects and data analysis much more efficient.
- Version History: Google Sheets keeps a record of every change made, allowing you to view and restore previous versions of your document.
- Data Functions and Formulas: Google Sheets offers a variety of built-in functions for performing calculations, analyzing data, and manipulating information efficiently.
- Conditional Formatting: This feature allows you to apply custom formatting based on the content of cells, making important data points stand out automatically.
- Charts and Data Visualization: You can create a range of charts, including bar charts, line graphs, and pie charts, to visualize your data more effectively.
- Cell Referencing: Google Sheets allows you to use cell references, both relative and absolute, to create dynamic formulas that can be reused across multiple cells or sheets.
- Add-Ons: Google Sheets supports add-ons, which are extensions that provide additional functionality, like integrating with third-party apps, automating tasks, or enhancing data analysis.
- Templates: Google Sheets offers a library of templates for everything from budgets and invoices to project trackers, helping you get started quickly without building a sheet from scratch.
How to Get Started with Google Sheets?
Google Sheets is a cloud-based spreadsheet tool that allows you to manage data, perform calculations, and collaborate with others in real-time. Whether you’re using it for personal tasks or business projects, Google Sheets offers all the essential features you need to organize and analyze your data. Let’s walk through the basics to get you up and running smoothly.
1. Create a New Google Sheet
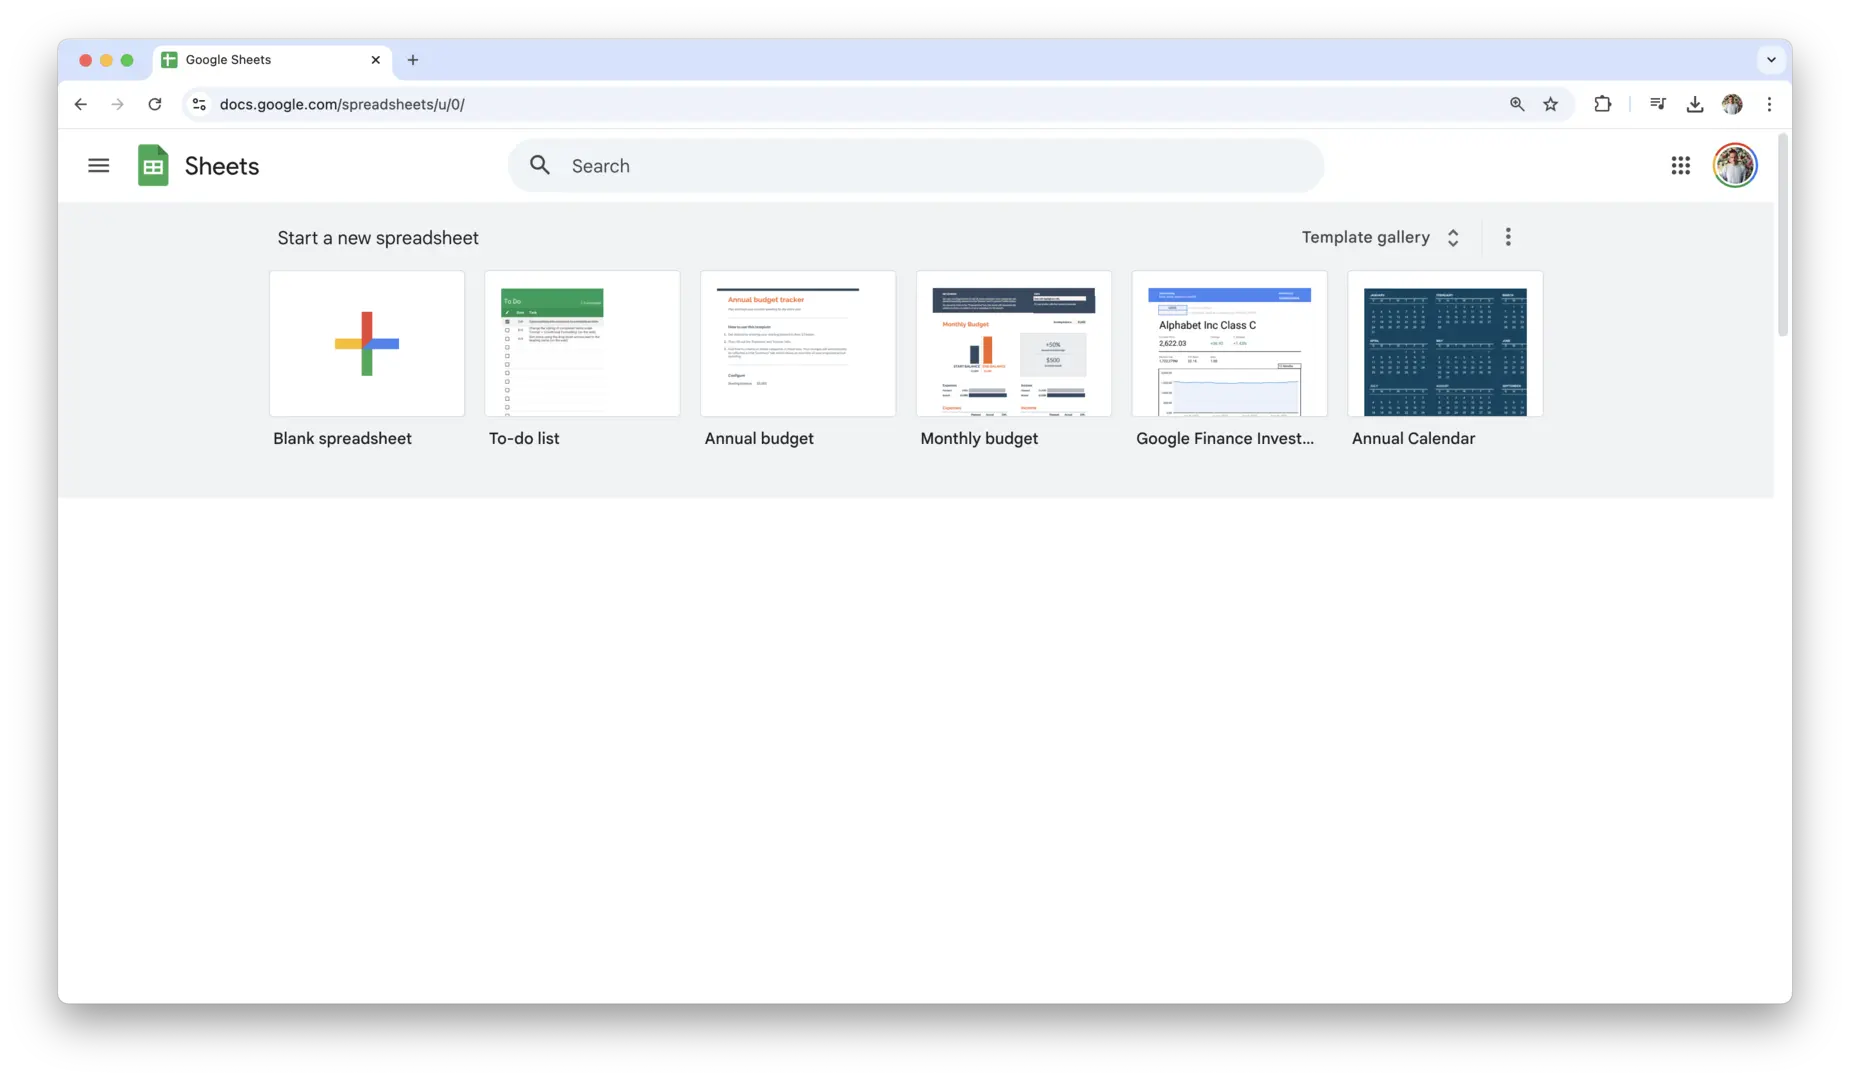
Starting a new Google Sheet is simple. First, head over to Google Sheets in your browser. If you’re already signed into your Google account, you’ll land on the Sheets home page where you can create a new file.
- To start a completely blank sheet, click the “+” button at the bottom-right corner of your screen.
- If you’re working with a specific template, Google Sheets offers a variety of pre-designed templates, such as budget planners, project trackers, and calendars. You can access these templates by selecting the Template Gallery at the top.
Once your new sheet is created, it’s automatically saved in Google Drive, which means you don’t have to worry about manually saving your work—everything is stored securely in the cloud.
2. Navigate the Interface: Menus, Toolbars, and Sheets
When you open a new Google Sheet, you’ll notice a clean and user-friendly interface. Let’s break down the key areas that will help you navigate efficiently.
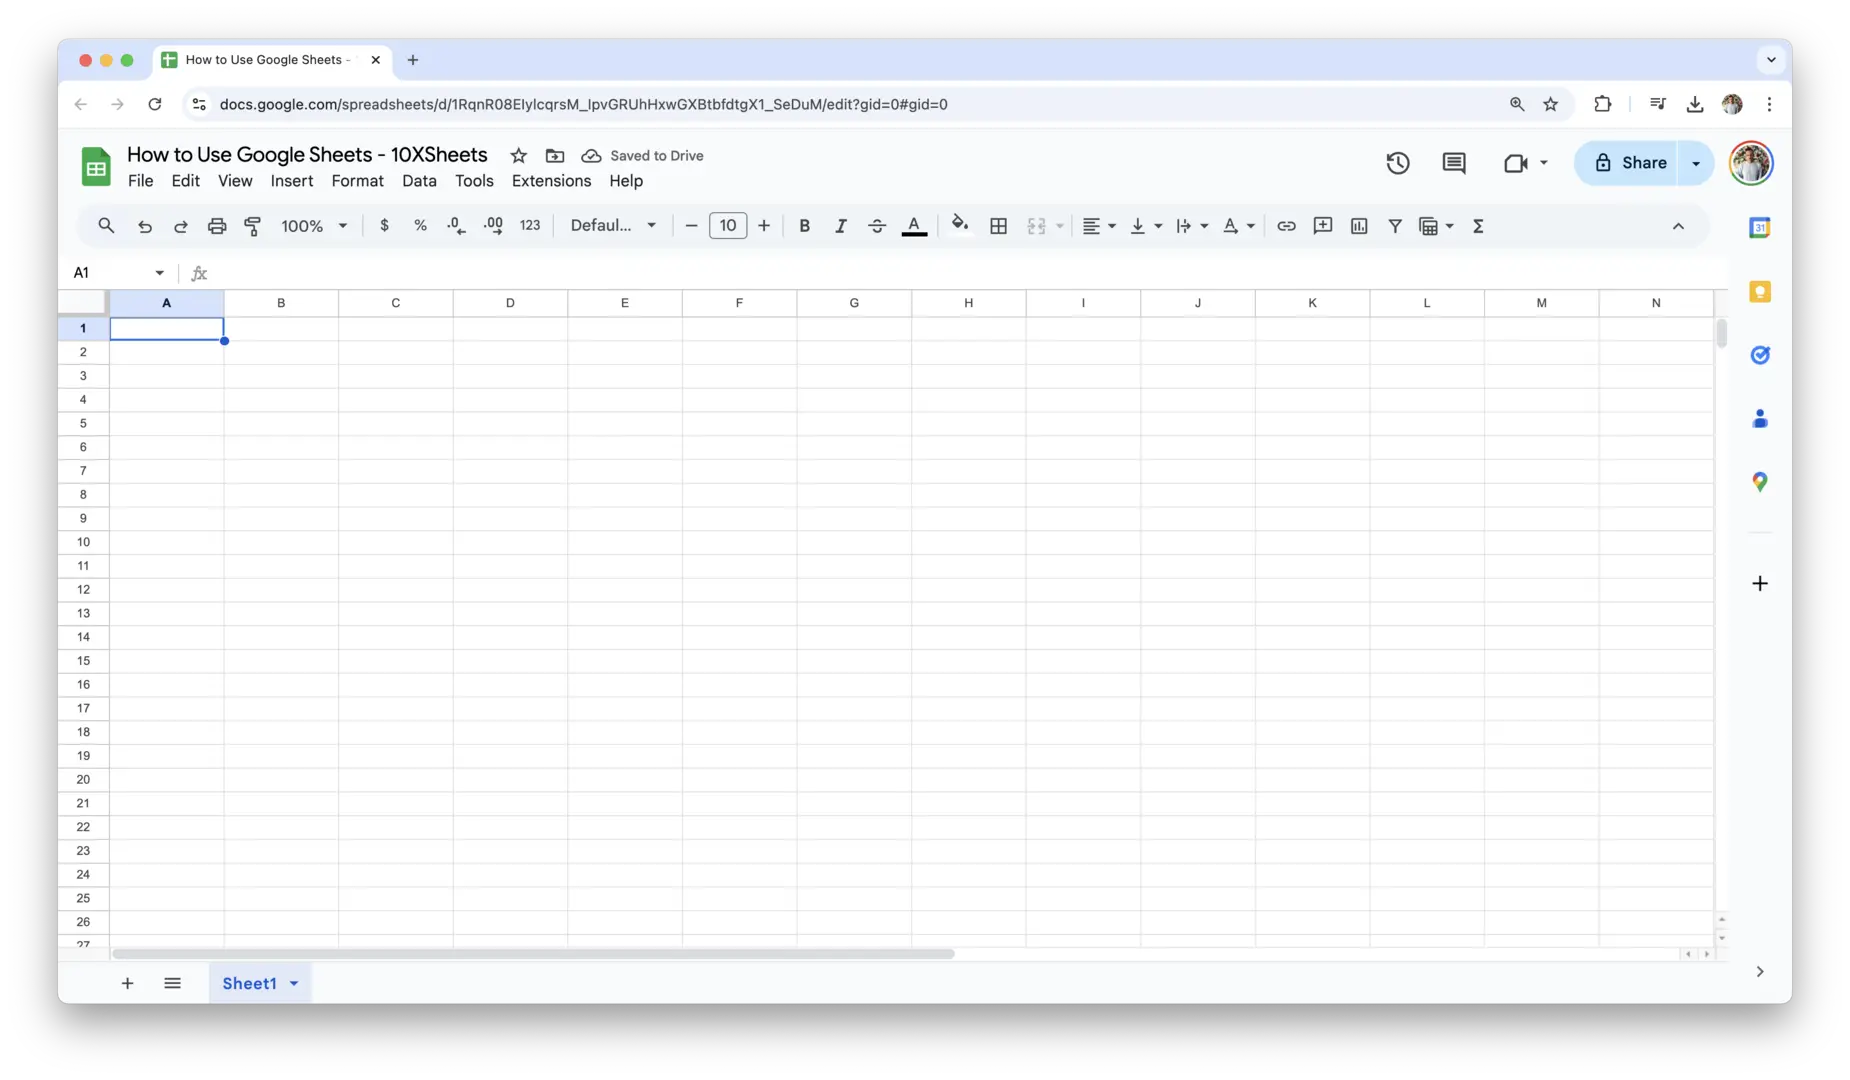
- Toolbar: This is located at the top of the screen and contains essential tools for formatting and editing your data. You’ll find buttons for common actions like undo, redo, font size, text alignment, and bold. You can also access your functions and formulas directly from the toolbar.
- Formula Bar: Directly below the toolbar, this is where you’ll see the content of any selected cell, including formulas and values. You can enter or edit data here.
- Sheets Tab: Located at the bottom, this section allows you to switch between multiple sheets within the same workbook. If you have a large project, you might want to keep different sheets for different sections of your work, such as one for finances, another for inventory, and so on. You can add or remove sheets by clicking the “+” button on the left of the sheet tabs.
- Cell Grid: The main area is where you enter your data. It’s a grid of rows and columns that form individual cells. You interact with these cells by entering data, formulas, or formatting.
3. Access Google Sheets from Different Devices
The beauty of Google Sheets lies in its cloud-based nature. It’s accessible from almost any device with internet access, so you can continue working on your projects whether you’re on your desktop, tablet, or smartphone.
- Desktop: Simply visit Google Sheets in your browser. If you’re logged into your Google account, your files are readily available. The interface is fully optimized for desktop use, so you can take advantage of all the advanced features with ease.
- Mobile: Google Sheets also offers apps for both iOS and Android, which you can download from the App Store or Google Play Store. The app allows you to view, edit, and share spreadsheets on the go. While the interface on mobile devices is slightly more compact, most key features are still available, including basic editing, commenting, and formula input.
- Offline Mode: With Google Sheets, you can continue working even when you’re not connected to the internet. Just set your file to be available offline via Google Drive, and you’ll be able to make changes that will sync once you’re back online.
4. Organize Your Sheets and Workbooks
As your use of Google Sheets expands, you’ll likely want to keep your sheets well-organized. Whether you’re managing a personal project or working with a team, good organization helps keep everything efficient and easy to navigate.
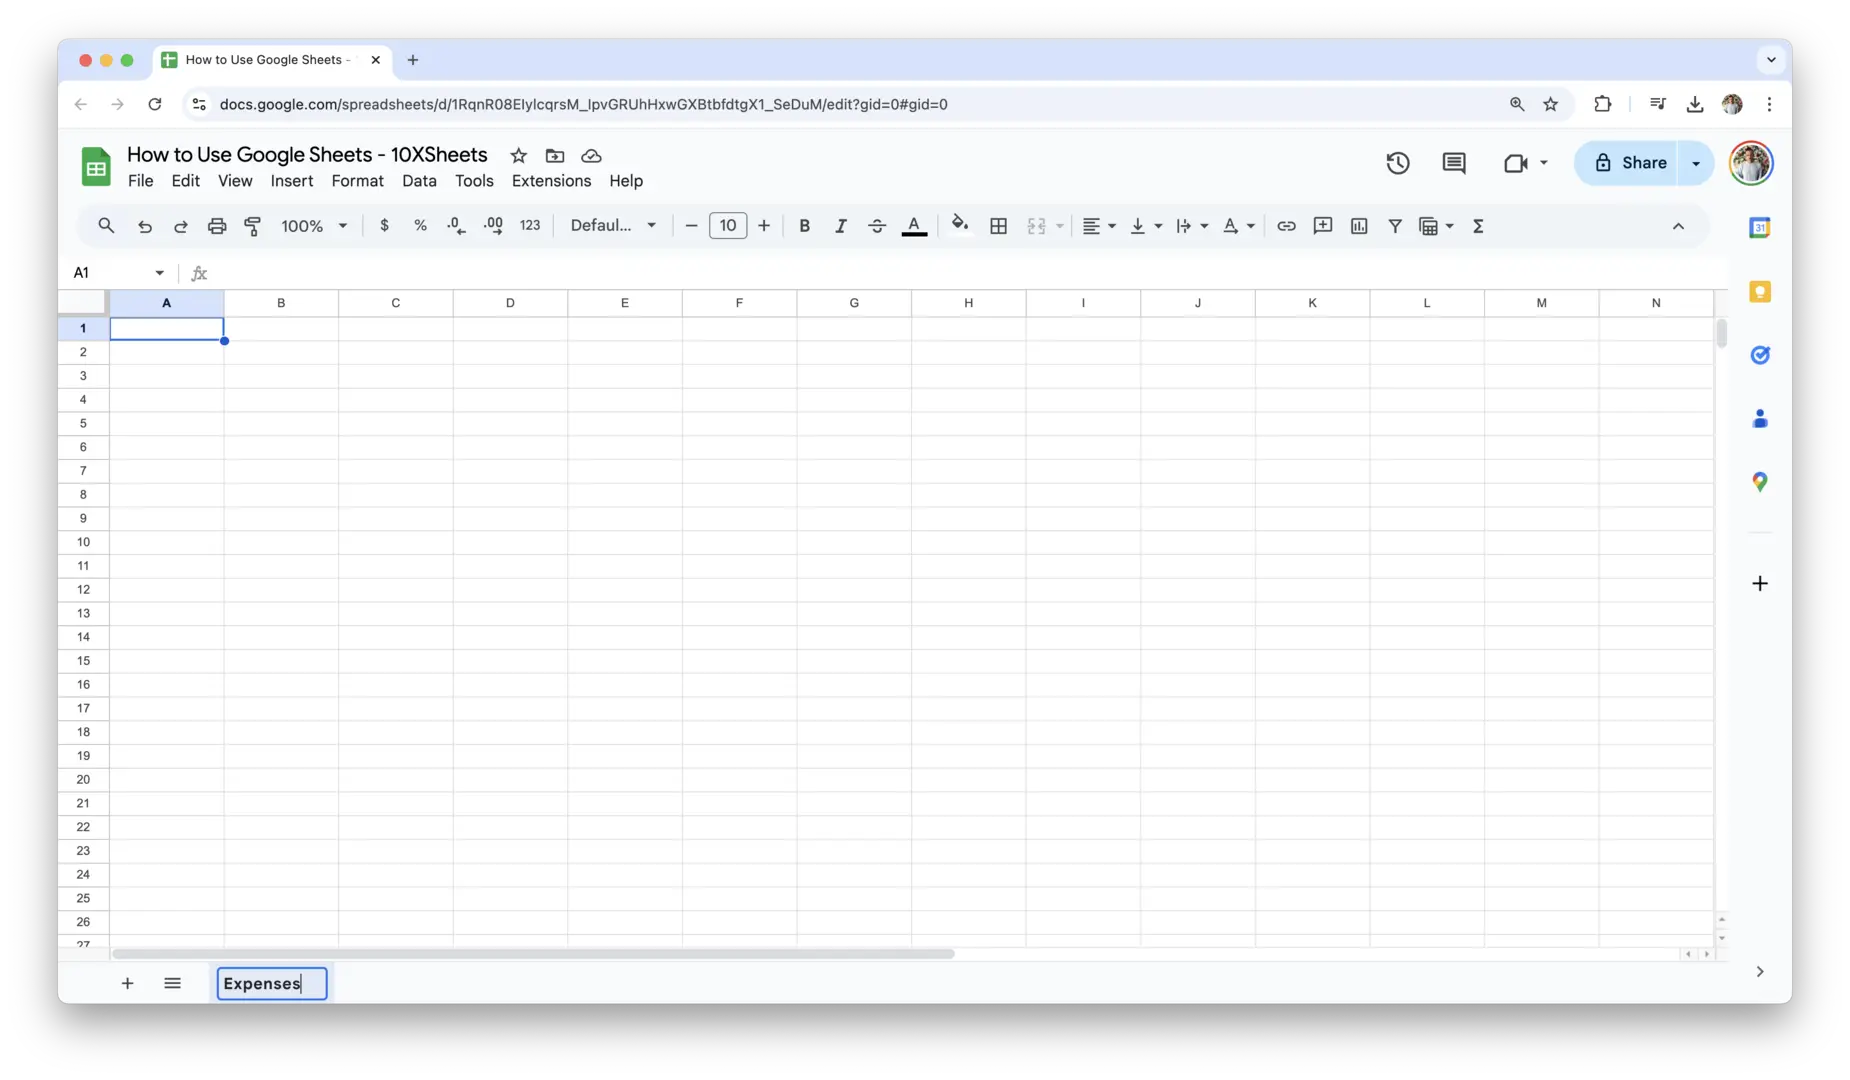
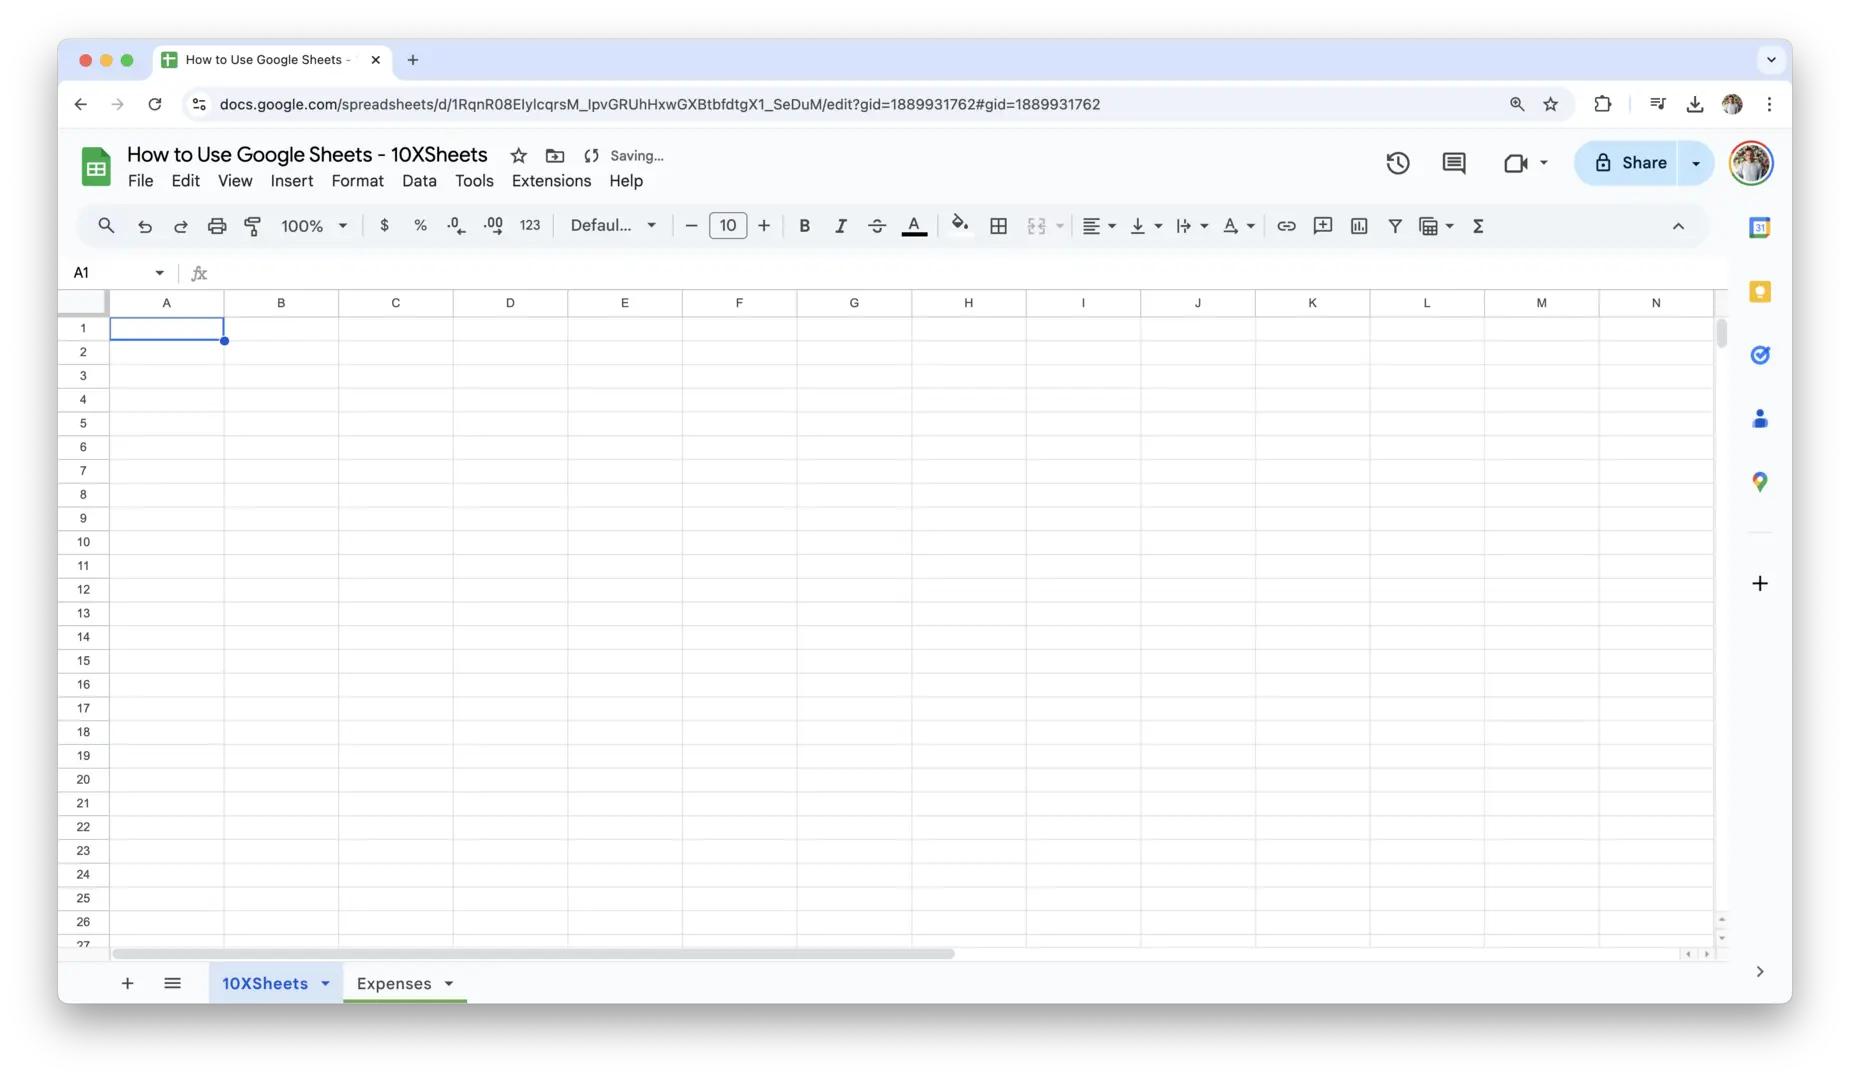
- Naming Sheets: When you create a new sheet, it will be given a default name like “Sheet1.” You can click on the sheet tab at the bottom to rename it to something more meaningful. For instance, if you’re tracking expenses, you might name it “Expenses”.

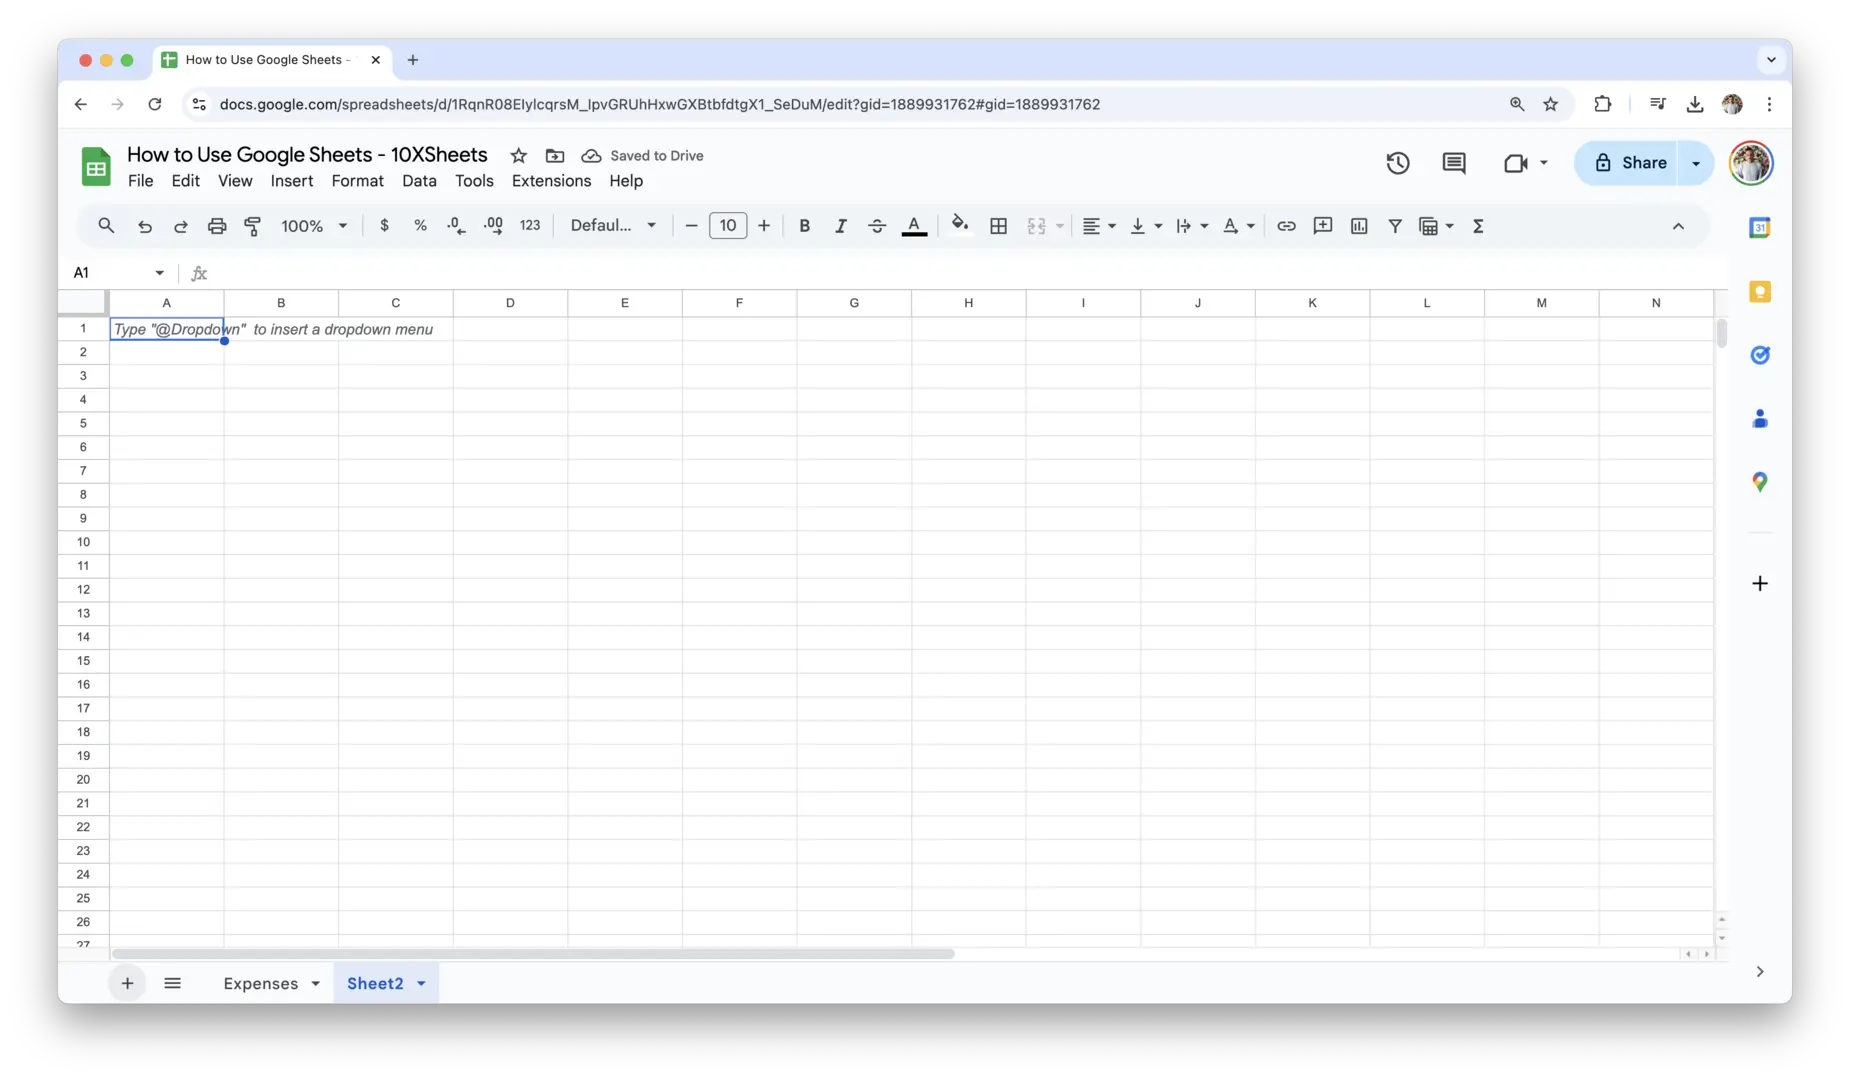
- Creating Multiple Sheets: A single Google Sheets file can contain multiple sheets (or tabs). To add a new sheet, simply click the “+” button at the bottom left. You can have a sheet for each category of your project, such as sales data, customer information, or monthly reports.
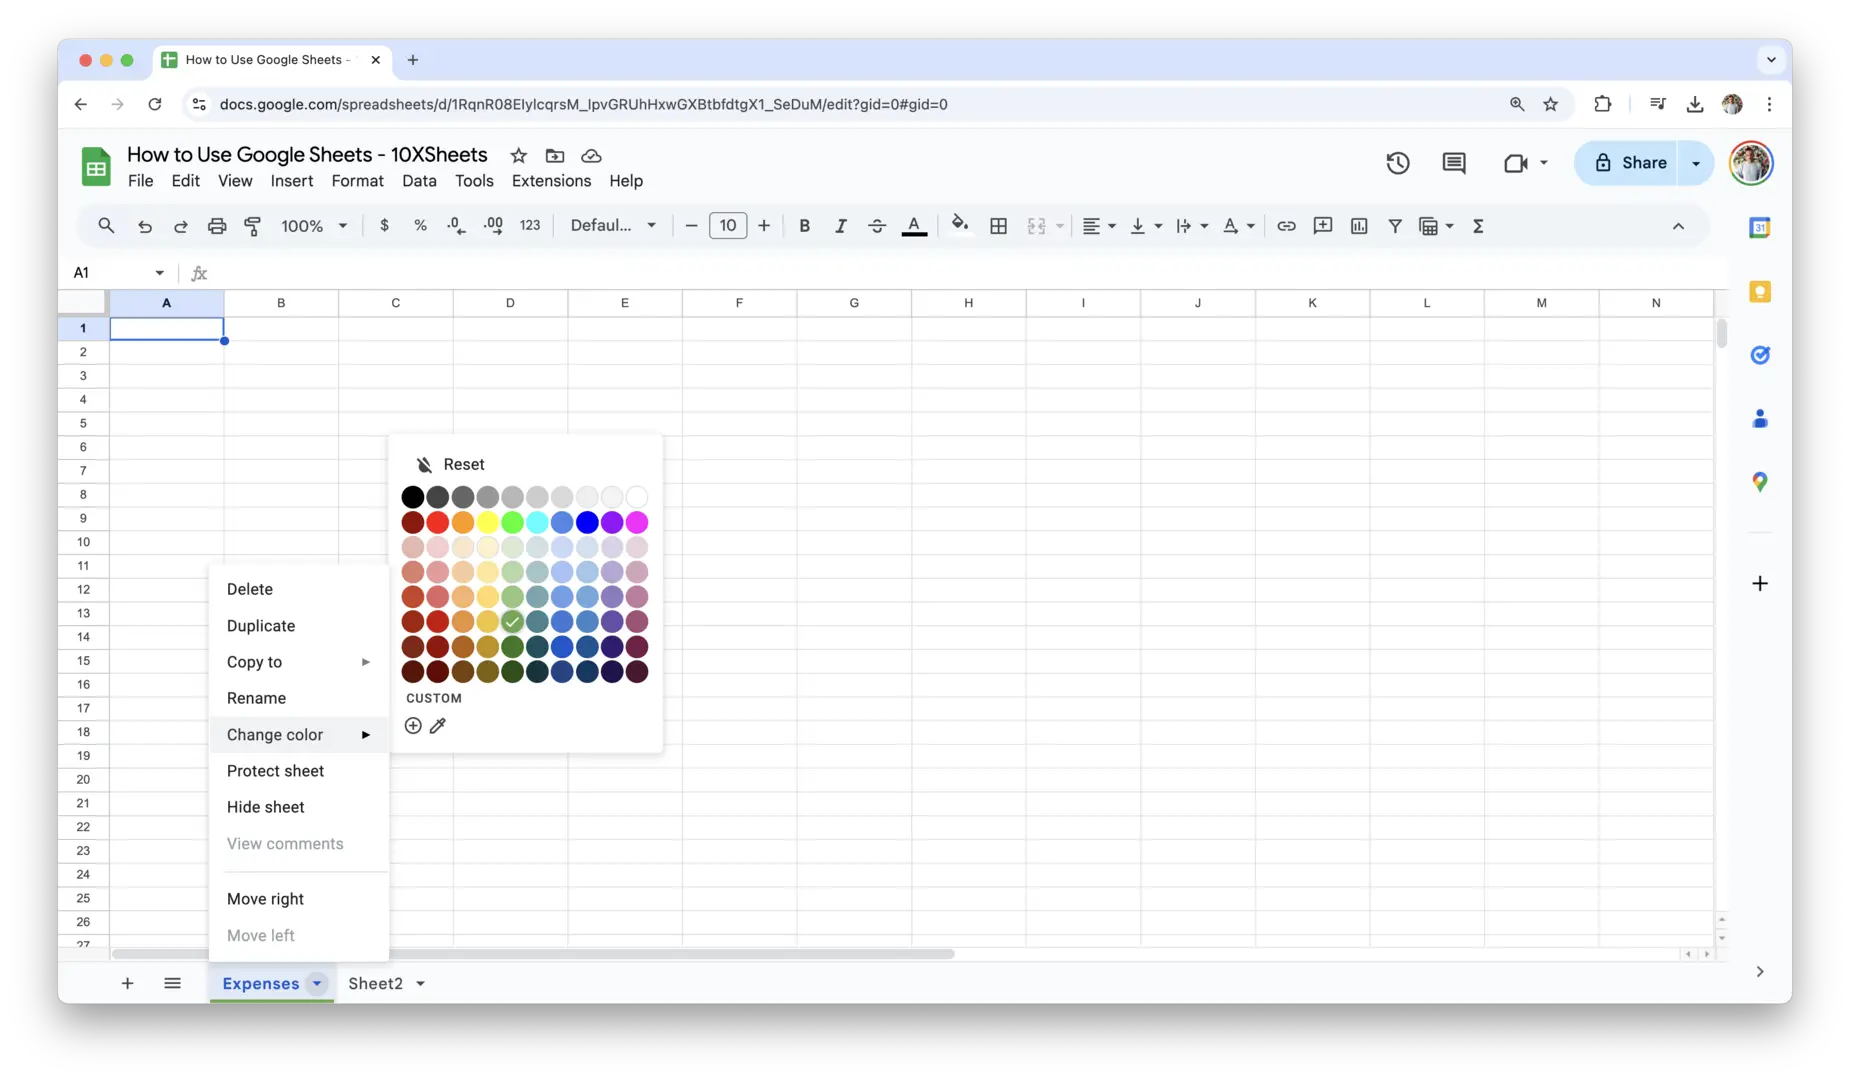
- Color-Coding Tabs: If you’re working with several sheets, it can be helpful to color-code your tabs to easily differentiate between them. Right-click on the tab name, select Change color, and pick the color that suits your organizational scheme.
- Rearranging Sheets: Sometimes, you might want to reorder your sheets for better workflow. You can easily drag and drop the sheet tabs to change their order, keeping related sheets together for easier access.
With these basic steps, you’ll be able to create, navigate, and organize your Google Sheets effectively. This foundation will set you up to dive deeper into more advanced features and functions as you continue working.
Basic Google Sheets Functions and Formulas
Google Sheets is a powerful tool for data manipulation, and the heart of that power lies in formulas. Whether you’re calculating totals, averages, or more complex equations, mastering the basics of formulas will make your work much more efficient.
Introduction to Formulas
At the core of Google Sheets, formulas allow you to perform calculations or manipulate data in your cells. Every formula starts with an equals sign (=), signaling to Google Sheets that you’re about to input a calculation. For example, if you wanted to add the values in cells A1 and B1, you’d use the formula:
=A1+B1
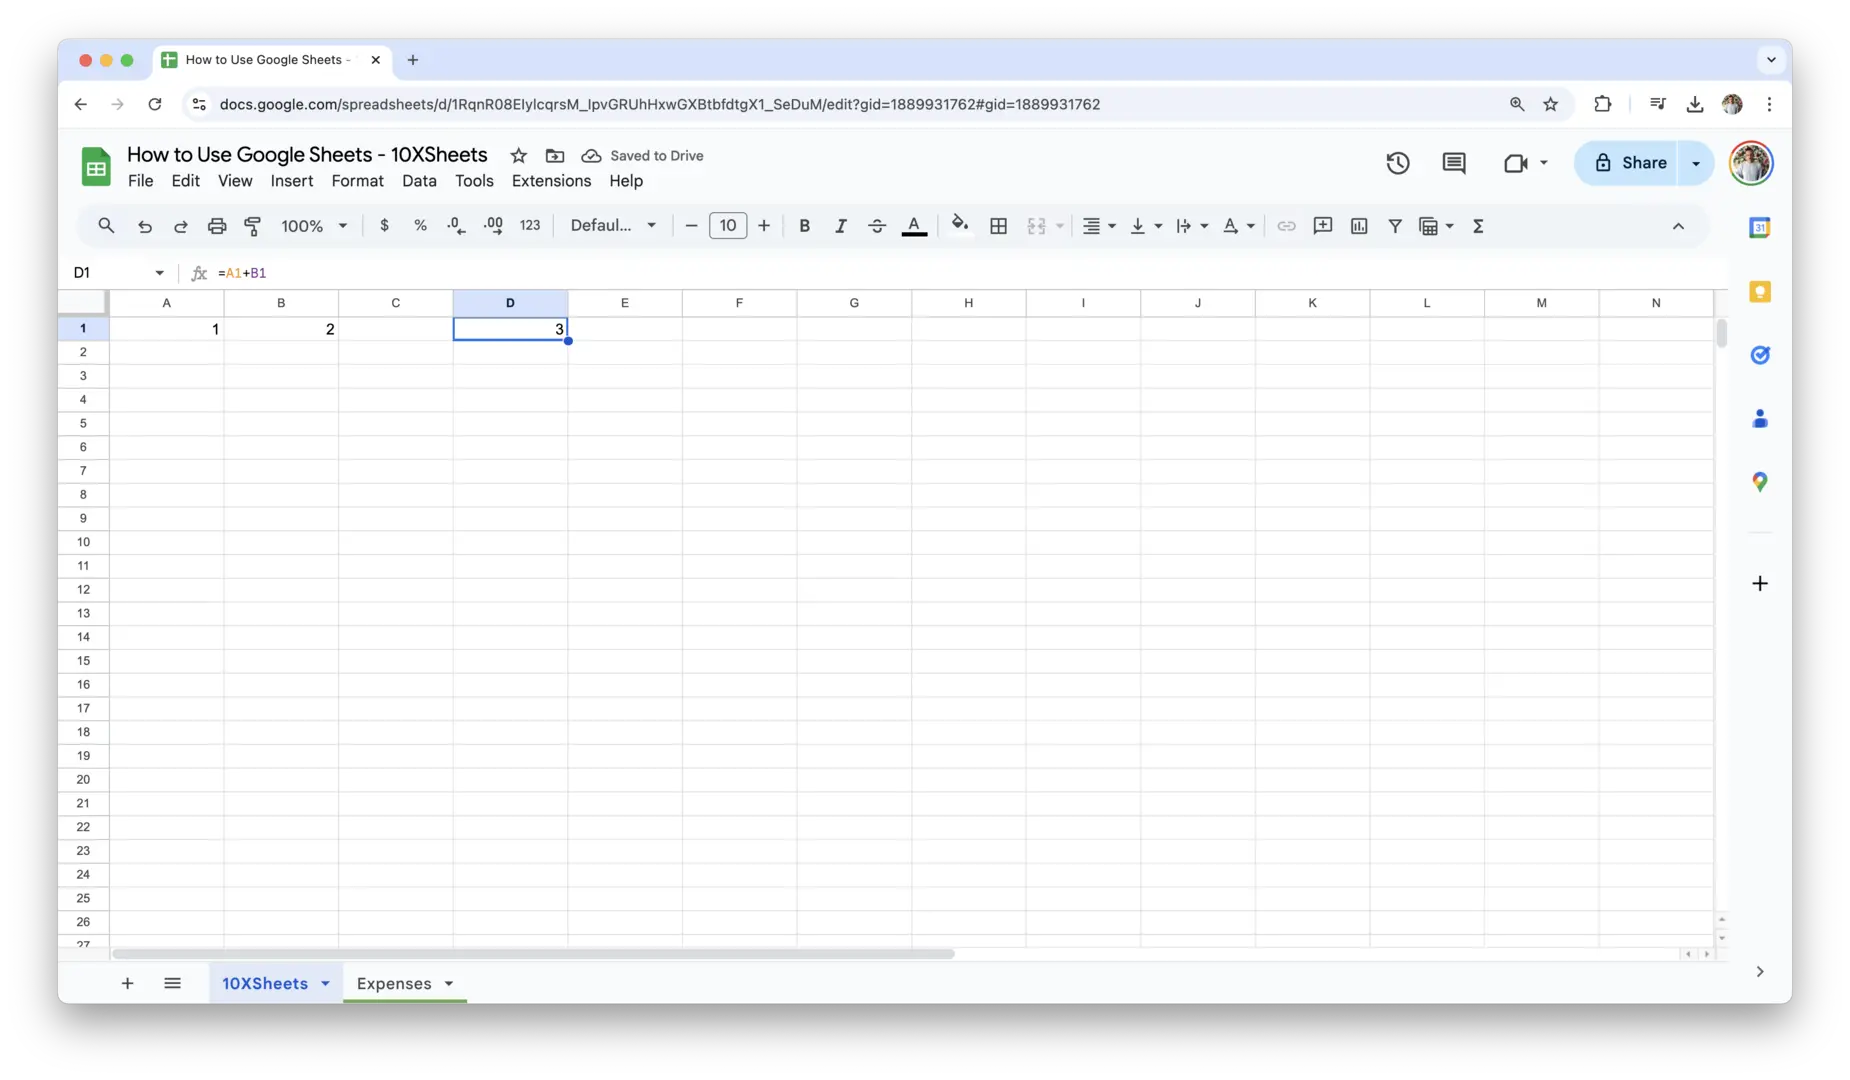
This simple formula tells Google Sheets to take the value from cell A1 and add it to the value in B1. From here, you can start exploring more advanced formulas like SUM, AVERAGE, IF, and others. Using formulas lets you save time, reduce errors, and perform complex tasks with just a few keystrokes.
Using Cell References and Basic Operations
Cell references are an essential part of any formula, as they allow you to link cells instead of hard-coding numbers. In Google Sheets, you can perform basic operations using simple arithmetic formulas. For example, to add the numbers in cells A1 and A2, you would enter:
=A1+A2
Google Sheets supports all the basic arithmetic operations:
- Addition:
+ - Subtraction:
- - Multiplication:
* - Division:
/
You can also perform more complex calculations using parentheses to control the order of operations. For instance:
=(A1+B1) * C1
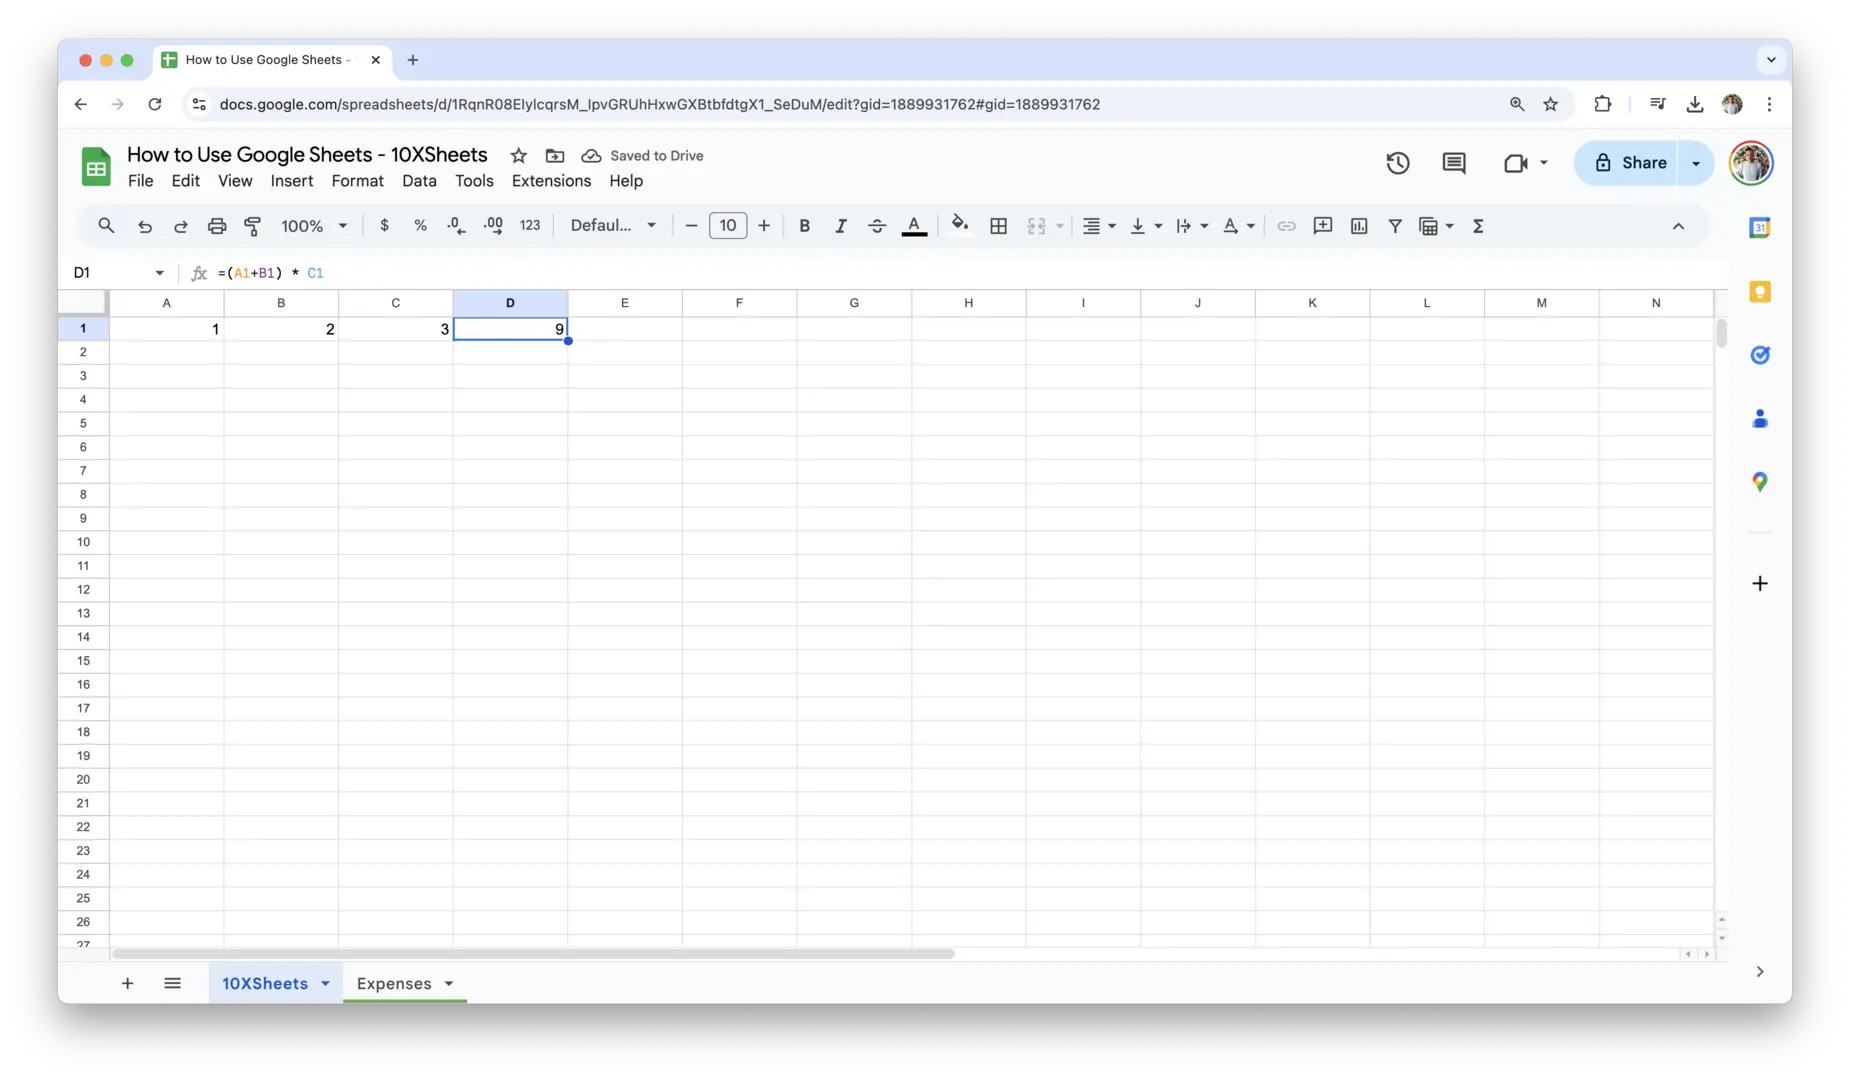
This formula adds A1 and B1 together first, then multiplies the result by C1.
Understanding Relative and Absolute References
One of the most powerful features in Google Sheets is the ability to use relative and absolute references in your formulas, which determines how your formula behaves when copied to other cells.
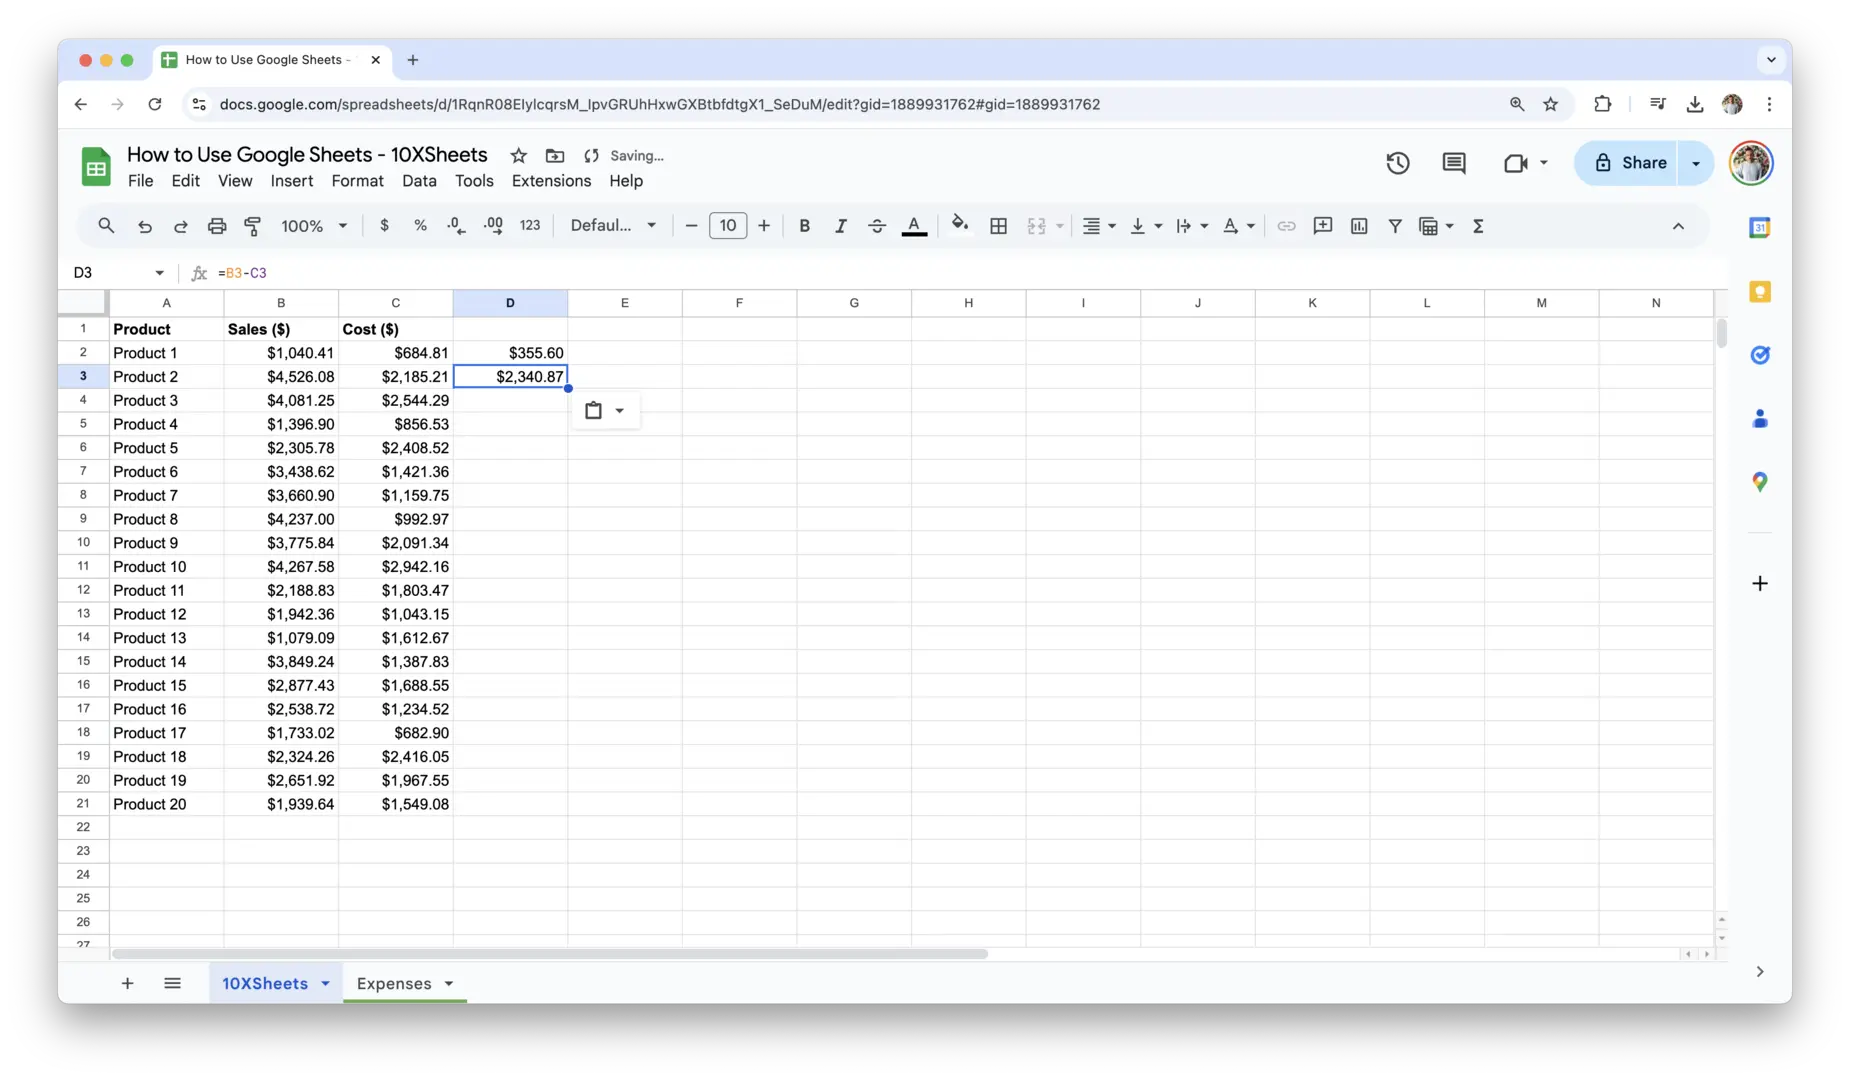
- Relative Reference: This is the default reference in Google Sheets. When you use a relative reference (e.g.,
A1), and copy the formula to another cell, the reference will adjust relative to the position. For example, if you copy the formula=B2-C2from cell C1 to C2, it will change to=B3-C3.
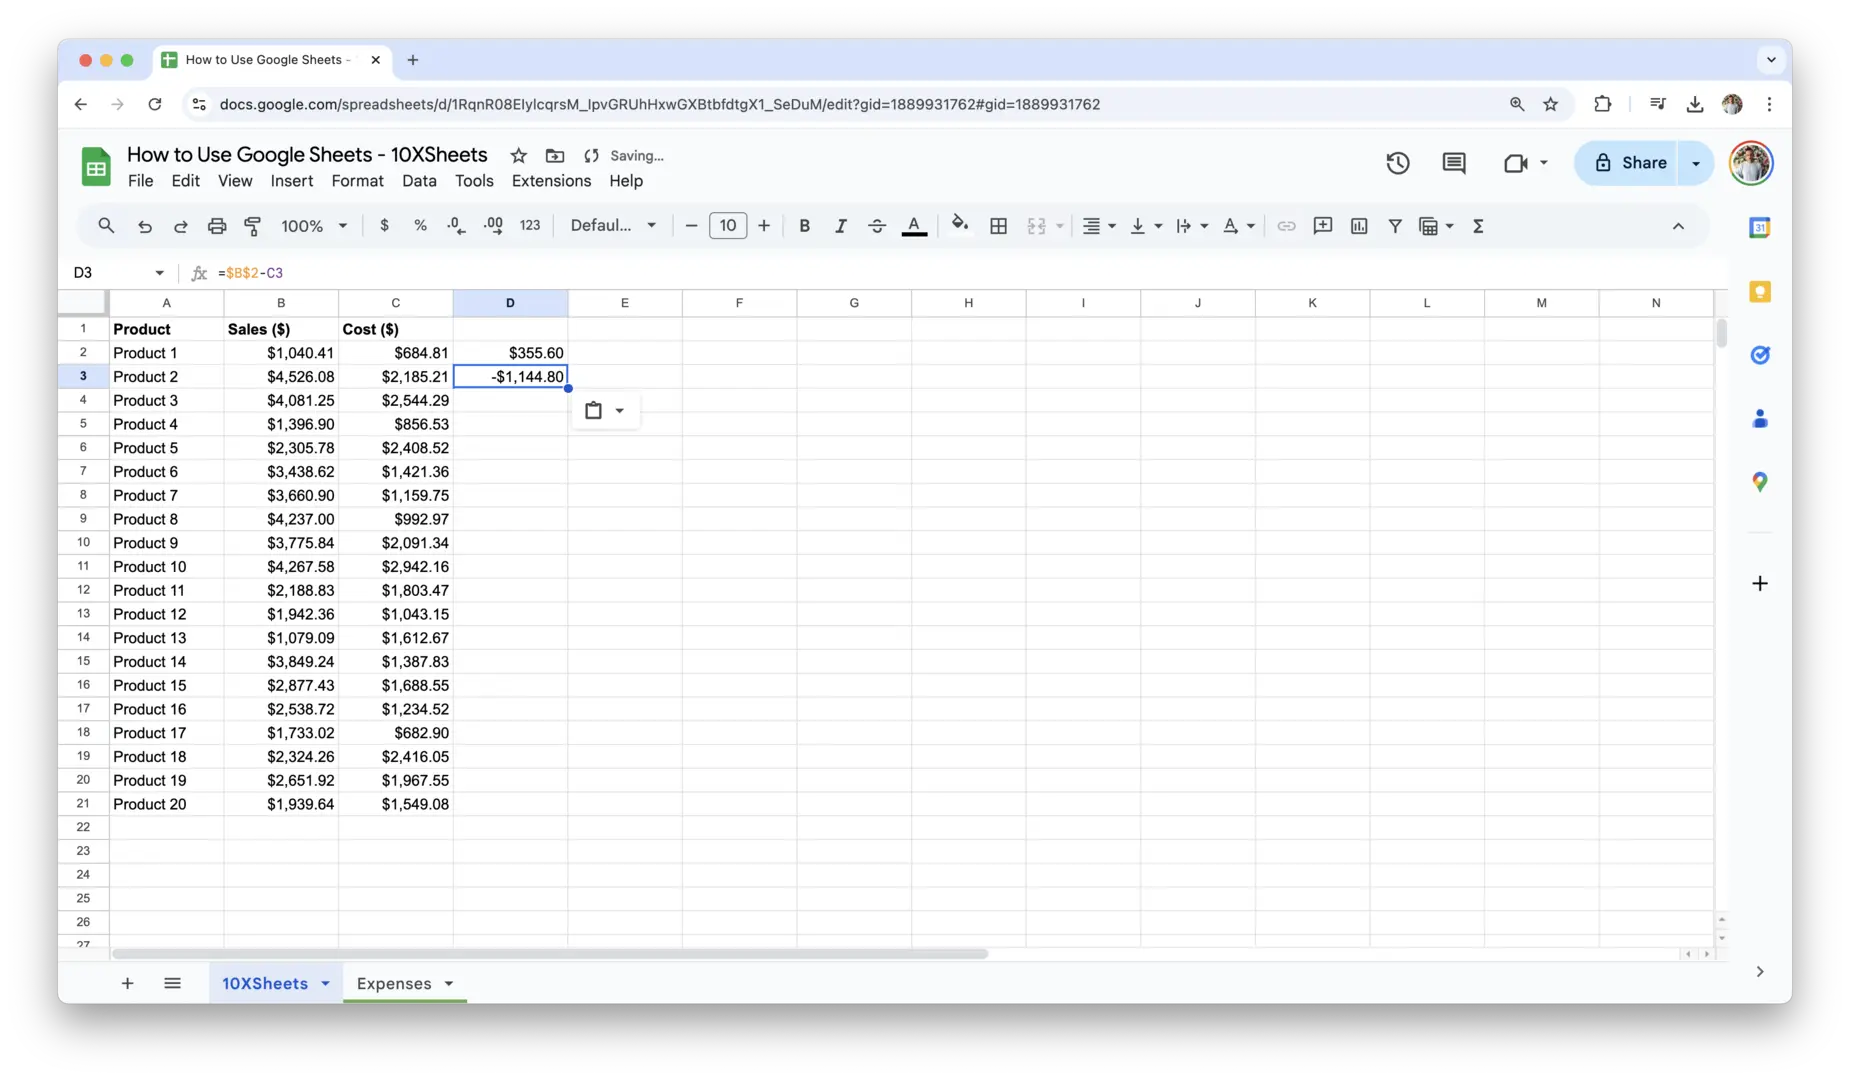
- Absolute Reference: If you want a cell reference to remain constant, regardless of where the formula is copied, use absolute references. This is done by adding dollar signs (
$) before the column and row (e.g.,$B$2). For example:
=$B$2-C2
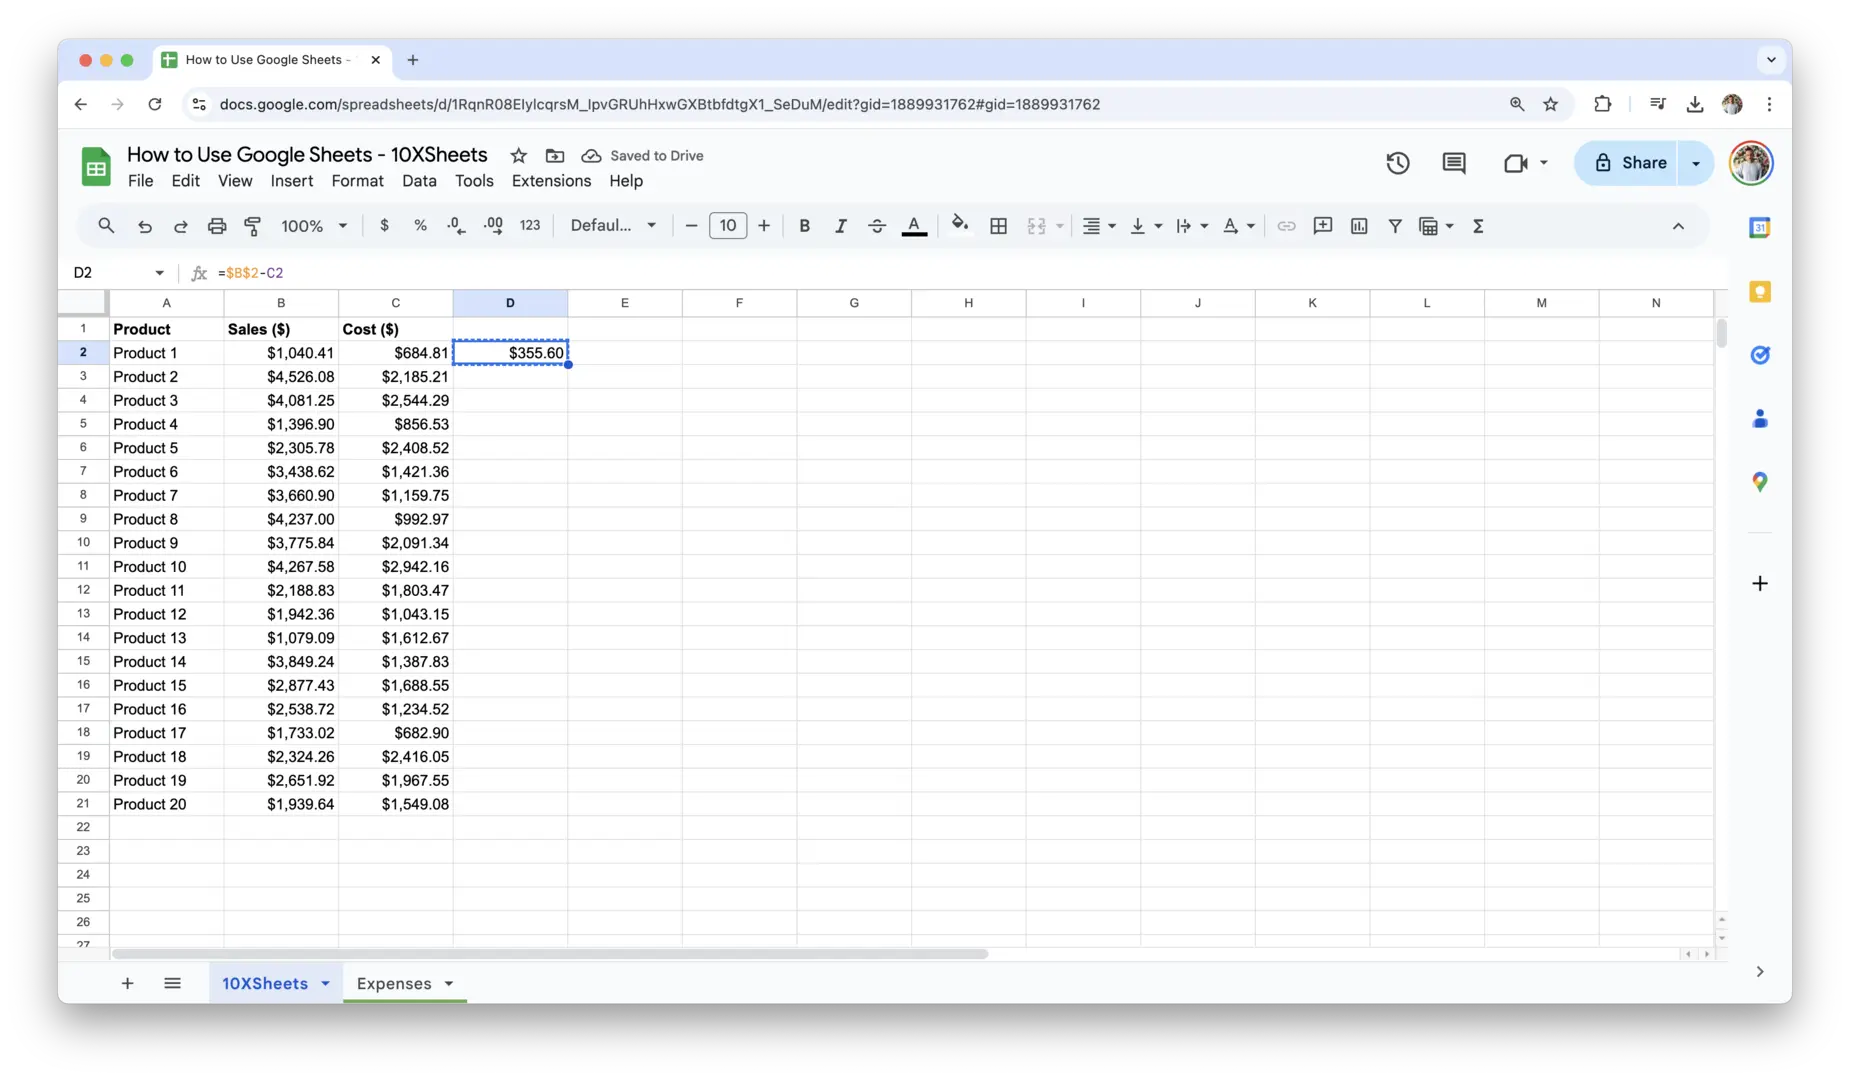
When this formula is copied to another cell, $A$1 remains locked to that specific cell, but B1 changes relative to the new position.
Working with Built-in Functions for Basic Data Manipulation
Google Sheets offers a variety of built-in functions to help you manipulate and analyze data quickly. Some of the most common functions include:
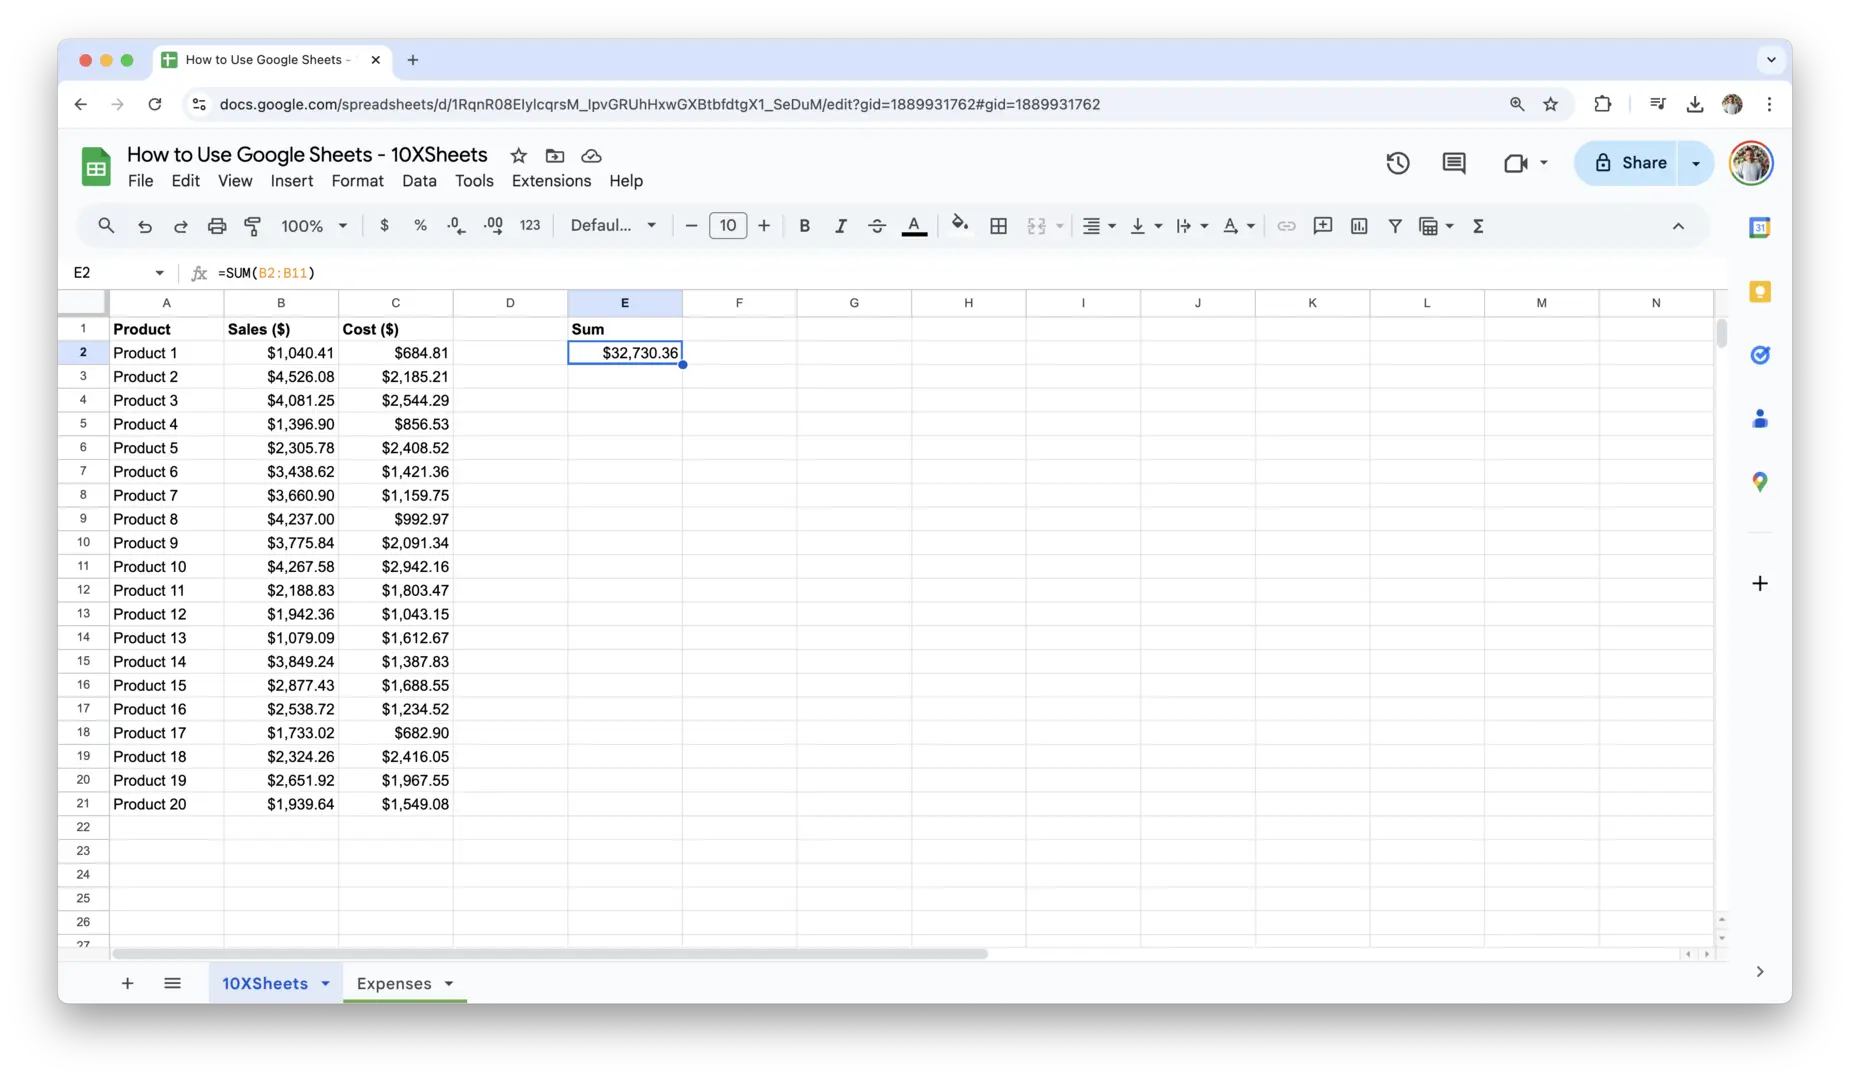
- SUM(): Adds together a range of numbers.
Example:=SUM(B2:B11)will give you the sum of all values in cells B2 through B11.
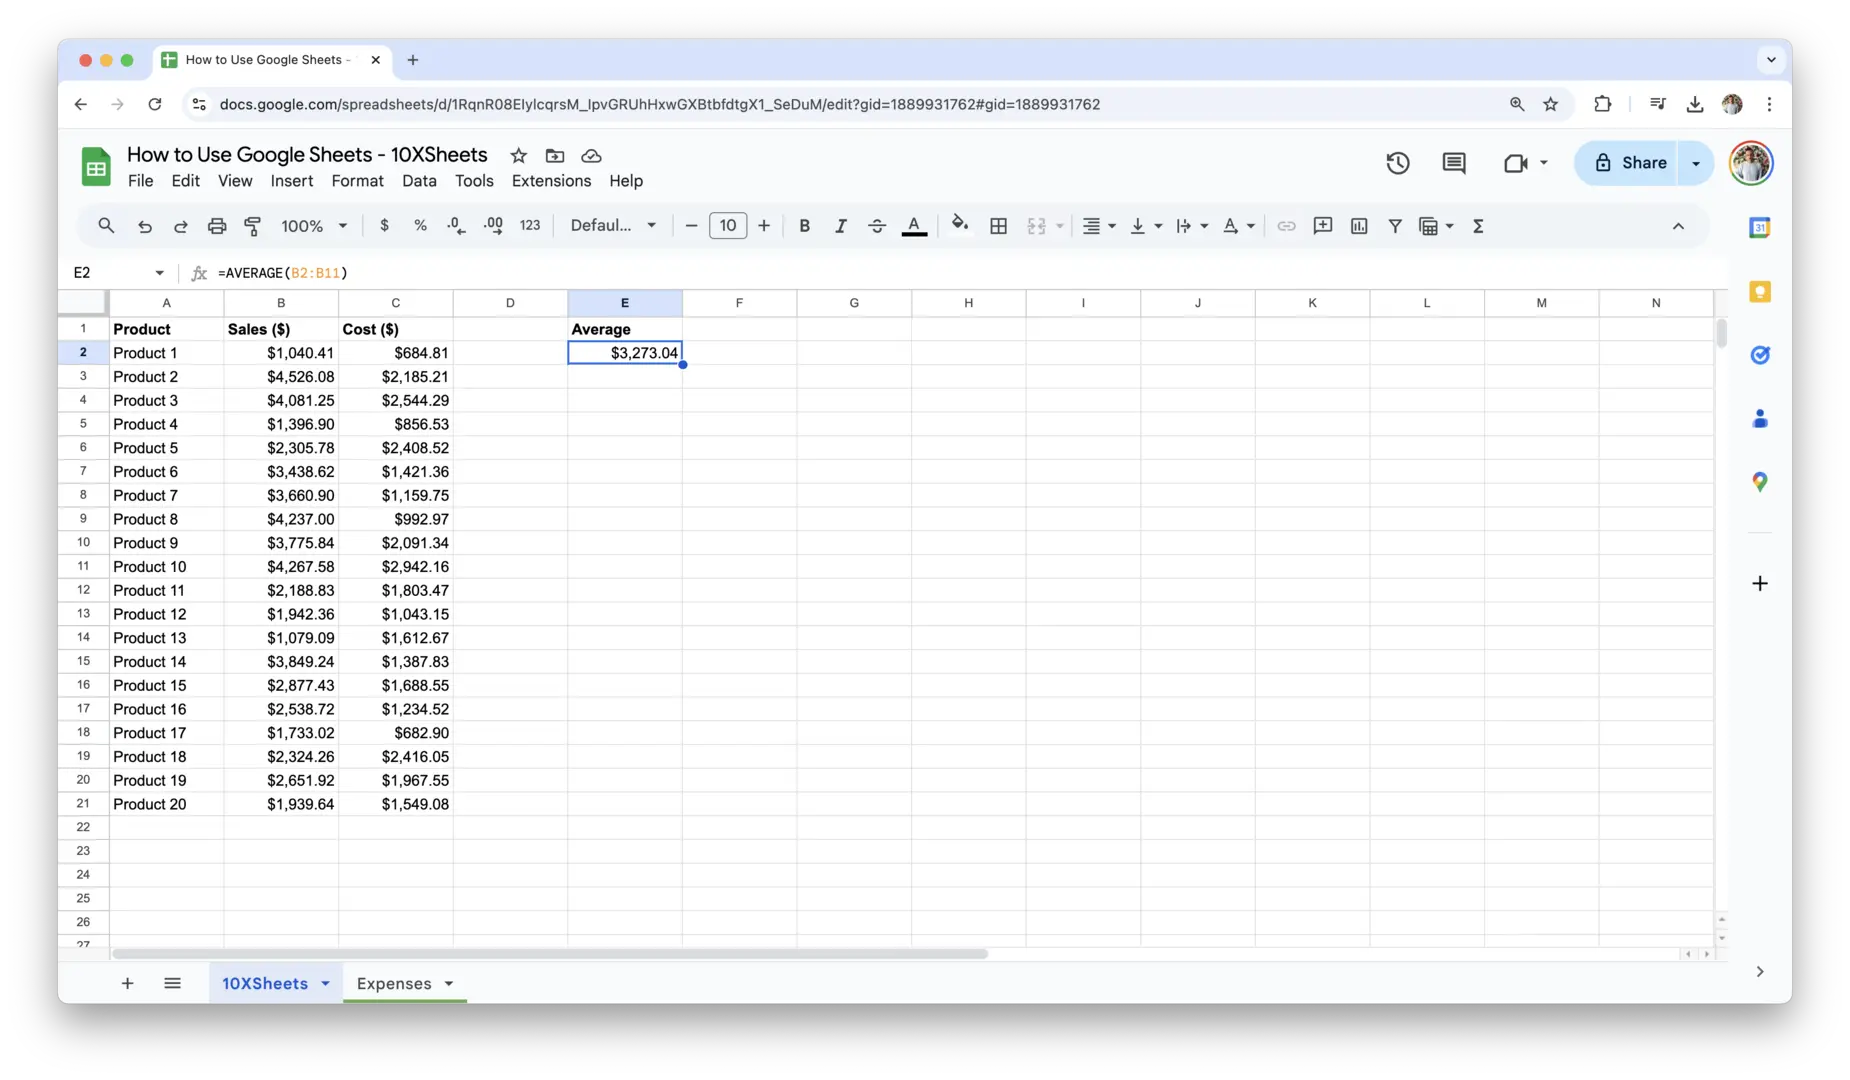
- AVERAGE(): Calculates the average of a range of numbers.
Example:=AVERAGE(B2:B11)will return the average of the numbers in the range.
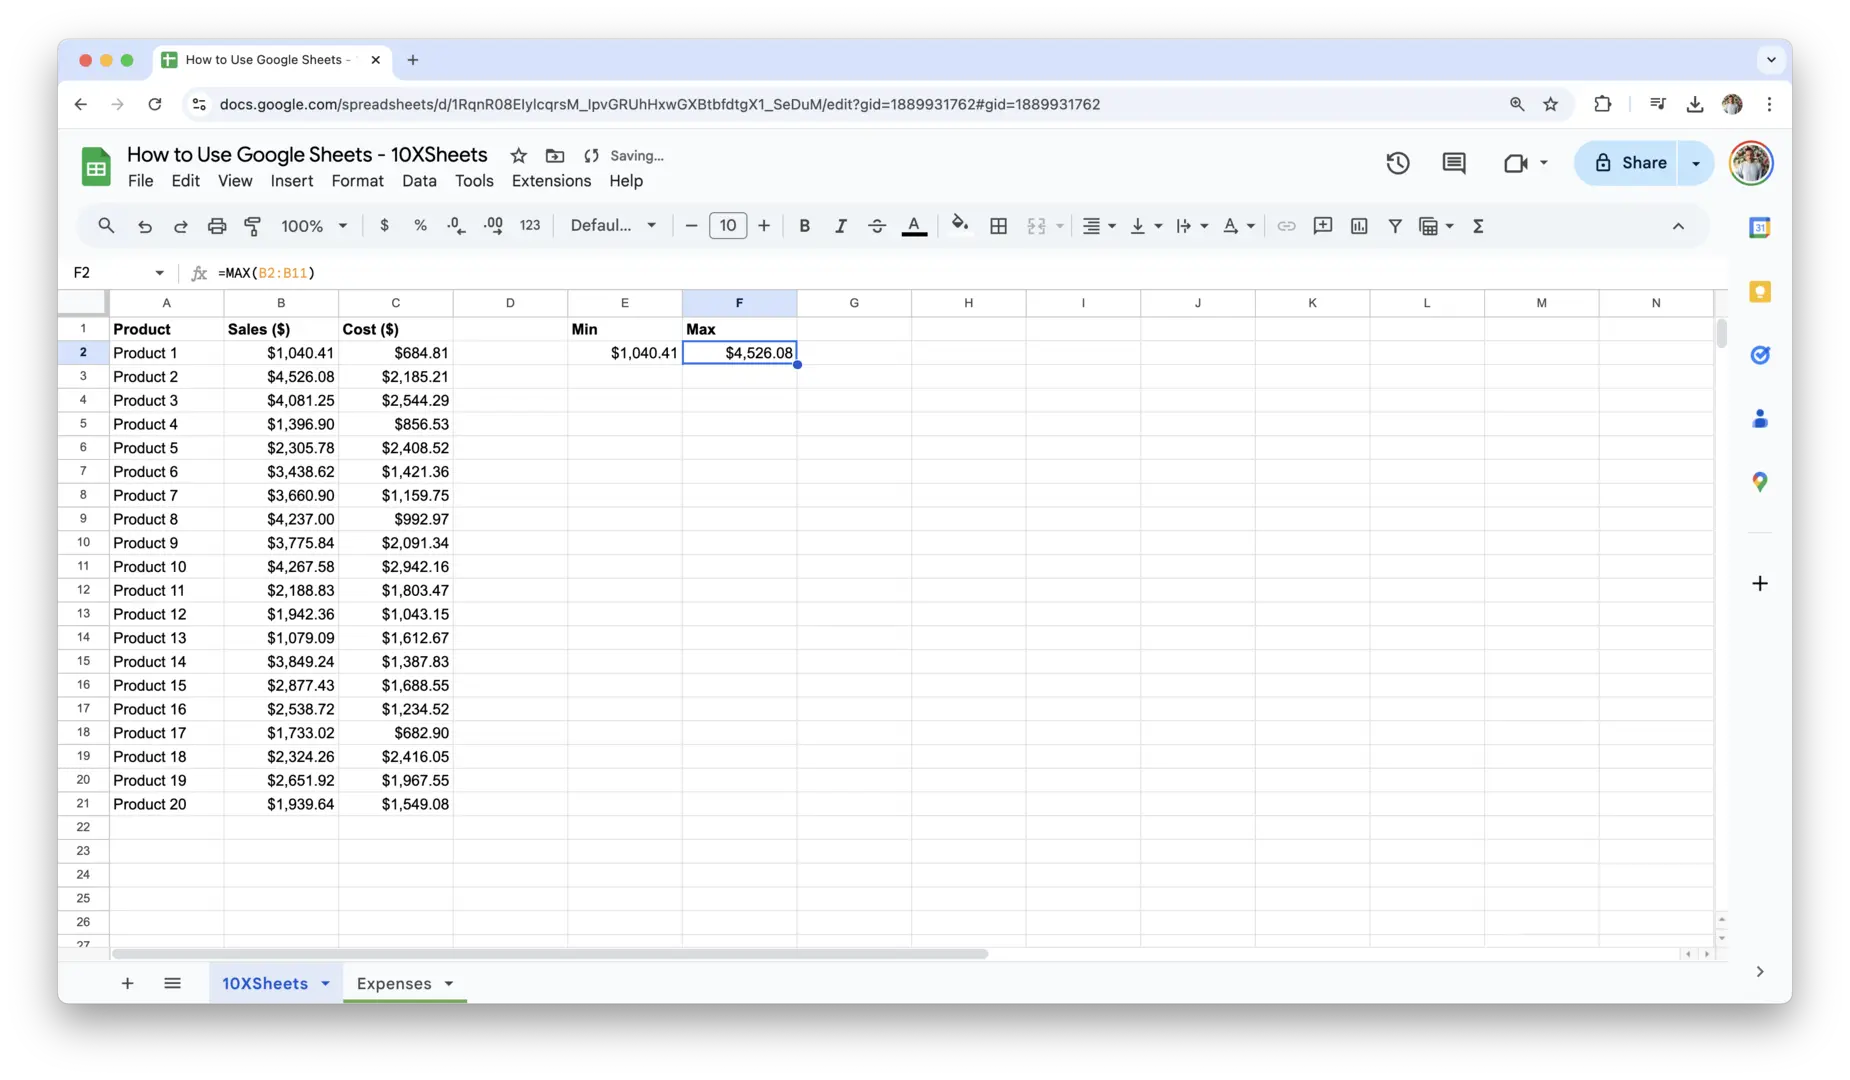
- MIN() and MAX(): Returns the minimum or maximum value from a given range of numbers.
Example:=MIN(B2:B11)or=MAX(B2:B11)
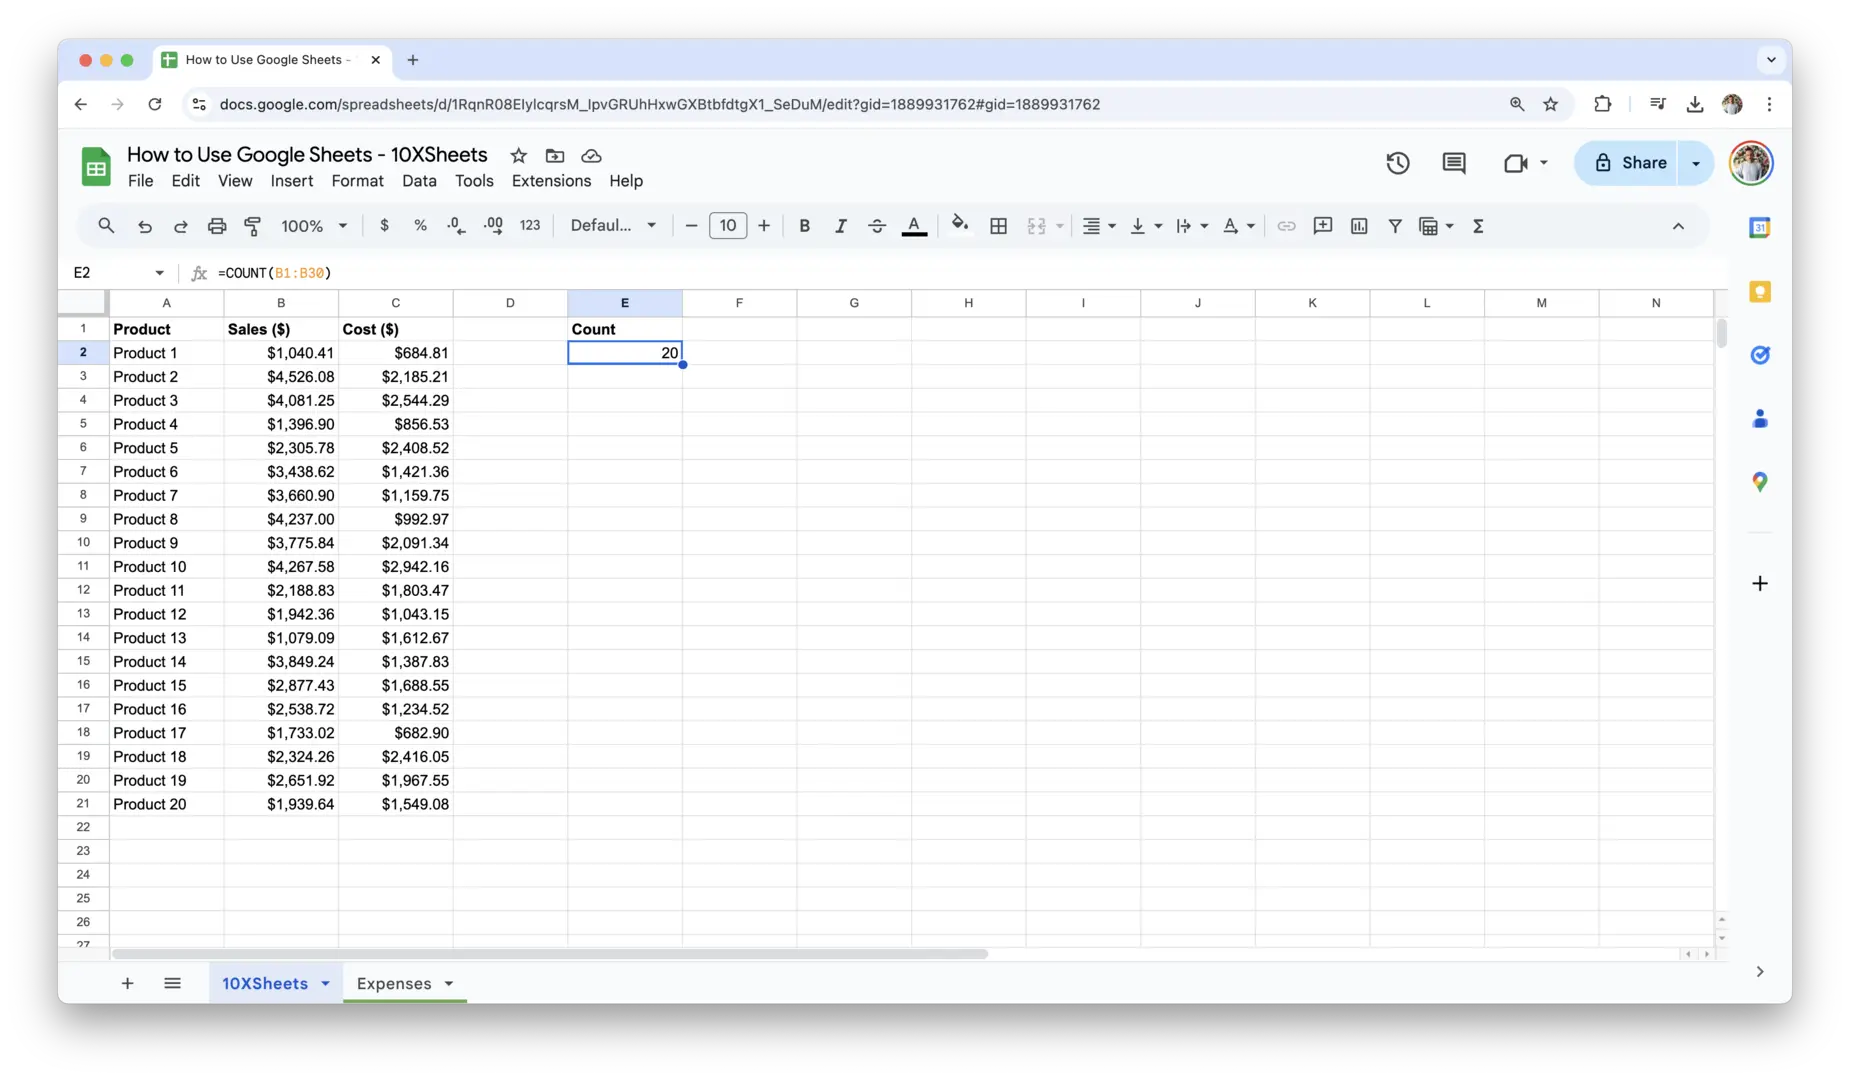
- COUNT(): Counts the number of cells containing numbers in a range.
Example:=COUNT(B1:B30)will count how many cells in the range B1 to B30 have numeric values.
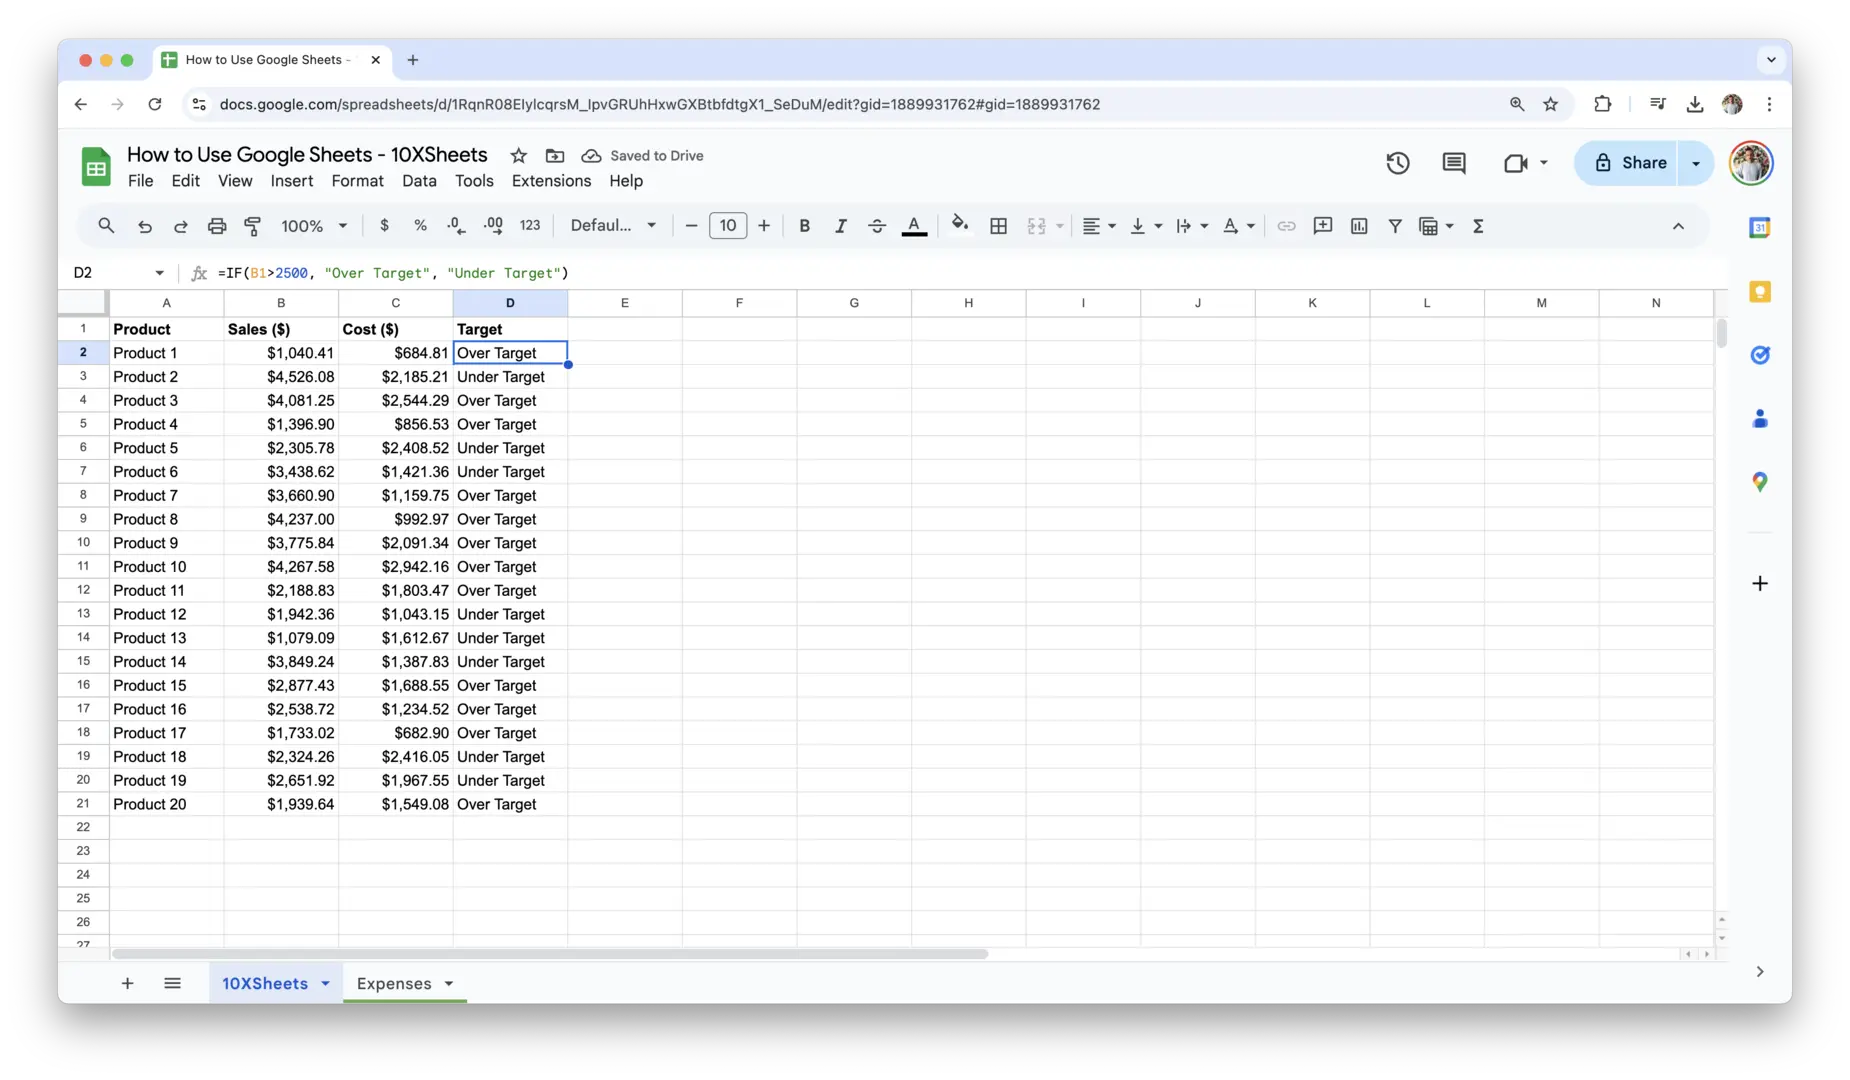
- IF(): Performs conditional logic. If the condition is true, it returns one value; if it’s false, it returns another.
Example:=IF(B2>2500, "Over Target", "Under Target")
These basic functions are essential for anyone working with data in Google Sheets and can be combined in various ways to create more powerful calculations.
How to Format Your Google Sheet?
Formatting is not just about making your sheet look good—it’s about making your data easy to read and interpret. The right formatting choices can improve your productivity, reduce mistakes, and help present your data in a more professional way.
Changing Text Formatting
Text formatting allows you to adjust the appearance of the data in your cells, making it easier to read and understand. You can modify the following text properties:
- Font Style: Use the Font dropdown in the toolbar to select from various fonts like Arial, Times New Roman, or even custom fonts.
- Font Size: Adjust the font size to make headings stand out or reduce the size for more detailed information. This can be done through the font size dropdown.
- Bold, Italic, and Underline: These are essential tools for emphasizing important data. You can apply bold, italic, or underline styles directly from the toolbar for any selected text.
- Text Alignment: Align your text to the left, center, or right, or adjust it vertically to the top, middle, or bottom of the cell. Proper alignment can make your sheet look much more organized.
To modify text formatting, simply select the cell or range of cells you want to adjust, and then use the appropriate toolbar options.
Conditional Formatting: Rules and Use Cases
Conditional formatting is a powerful tool that changes the appearance of a cell based on its value. This helps you quickly identify trends, outliers, or important data points. For instance, you can set rules to highlight cells that meet specific criteria, such as values above a certain threshold.
- Highlighting Data: You could apply a rule to highlight cells that contain values greater than 100, making it easier to spot outliers.
- Color Scales: Another useful feature is applying color scales, where higher values are colored differently from lower ones, helping you visualize the distribution of your data at a glance.
- Custom Rules: Google Sheets lets you create custom rules based on formulas. For example, you can highlight cells where the value is a specific text string or matches a date range.
To use conditional formatting, select the cells you want to format, click Format > Conditional formatting, and then define the rules. The cell formatting will automatically update based on the criteria you set.
Adjusting Row/Column Size, Freezing Panes, and Splitting Cells
Google Sheets gives you flexibility in how you adjust the layout and organization of your data.
- Row and Column Size: You can resize rows and columns by clicking and dragging the lines between them. This makes it easier to fit your data without unnecessary gaps or truncation. For example, if you have a long list of names, adjusting the column width will ensure they are fully visible.
- Freezing Panes: When working with large datasets, you may want to keep certain rows or columns visible while you scroll through the rest of the sheet. This is where freezing panes comes in. You can freeze the top row to keep column headers in view as you scroll down, or freeze the first column to keep your labels visible as you move across the sheet. To do this, click View > Freeze and choose your preferred option.
- Splitting Cells: Sometimes, you may want to split a cell into multiple smaller cells to organize your data better. While Google Sheets doesn’t have a direct “split cell” feature like Excel, you can accomplish a similar effect by merging cells or using a combination of formatting and formulas to distribute data across several cells.
Using Themes and Cell Styles for Consistency
Themes in Google Sheets help maintain a consistent visual style across your entire spreadsheet. This is especially useful if you’re creating a report or a presentation-ready document.
- Applying a Theme: To quickly apply a theme, click on Format > Theme. Google Sheets offers a selection of themes that will change the overall color scheme of your sheet, ensuring a cohesive design. The theme will automatically adjust the colors of your headers, borders, and text for better readability.
- Cell Styles: Beyond themes, you can also apply specific styles to individual cells. This includes things like applying background colors, borders, and font styles to draw attention to certain cells or create clear distinctions between sections of data. For example, you might want to apply a light gray background color to the header row, so it’s easily distinguishable from the rest of your data.
By leveraging these formatting tools, you can transform a plain spreadsheet into a professional and easy-to-read document that’s organized, visually appealing, and much easier to navigate.
Advanced Google Sheets Formulas and Functions
Once you’re comfortable with basic formulas in Google Sheets, it’s time to dive deeper into the more advanced formulas that can help you manipulate data in more complex ways. With these tools, you’ll be able to perform a wider range of calculations, look up values across large datasets, and work more efficiently.
Nested Formulas and Logical Functions
One of the most powerful ways to build more complex formulas is by nesting functions. A nested formula is when you place one function inside another to create a more dynamic outcome. For example, you might want to combine an IF() statement with other functions to perform conditional calculations.
Here’s an example:
=IF(AVERAGE(B2:B10) > 3000, "Above average", "Below average")
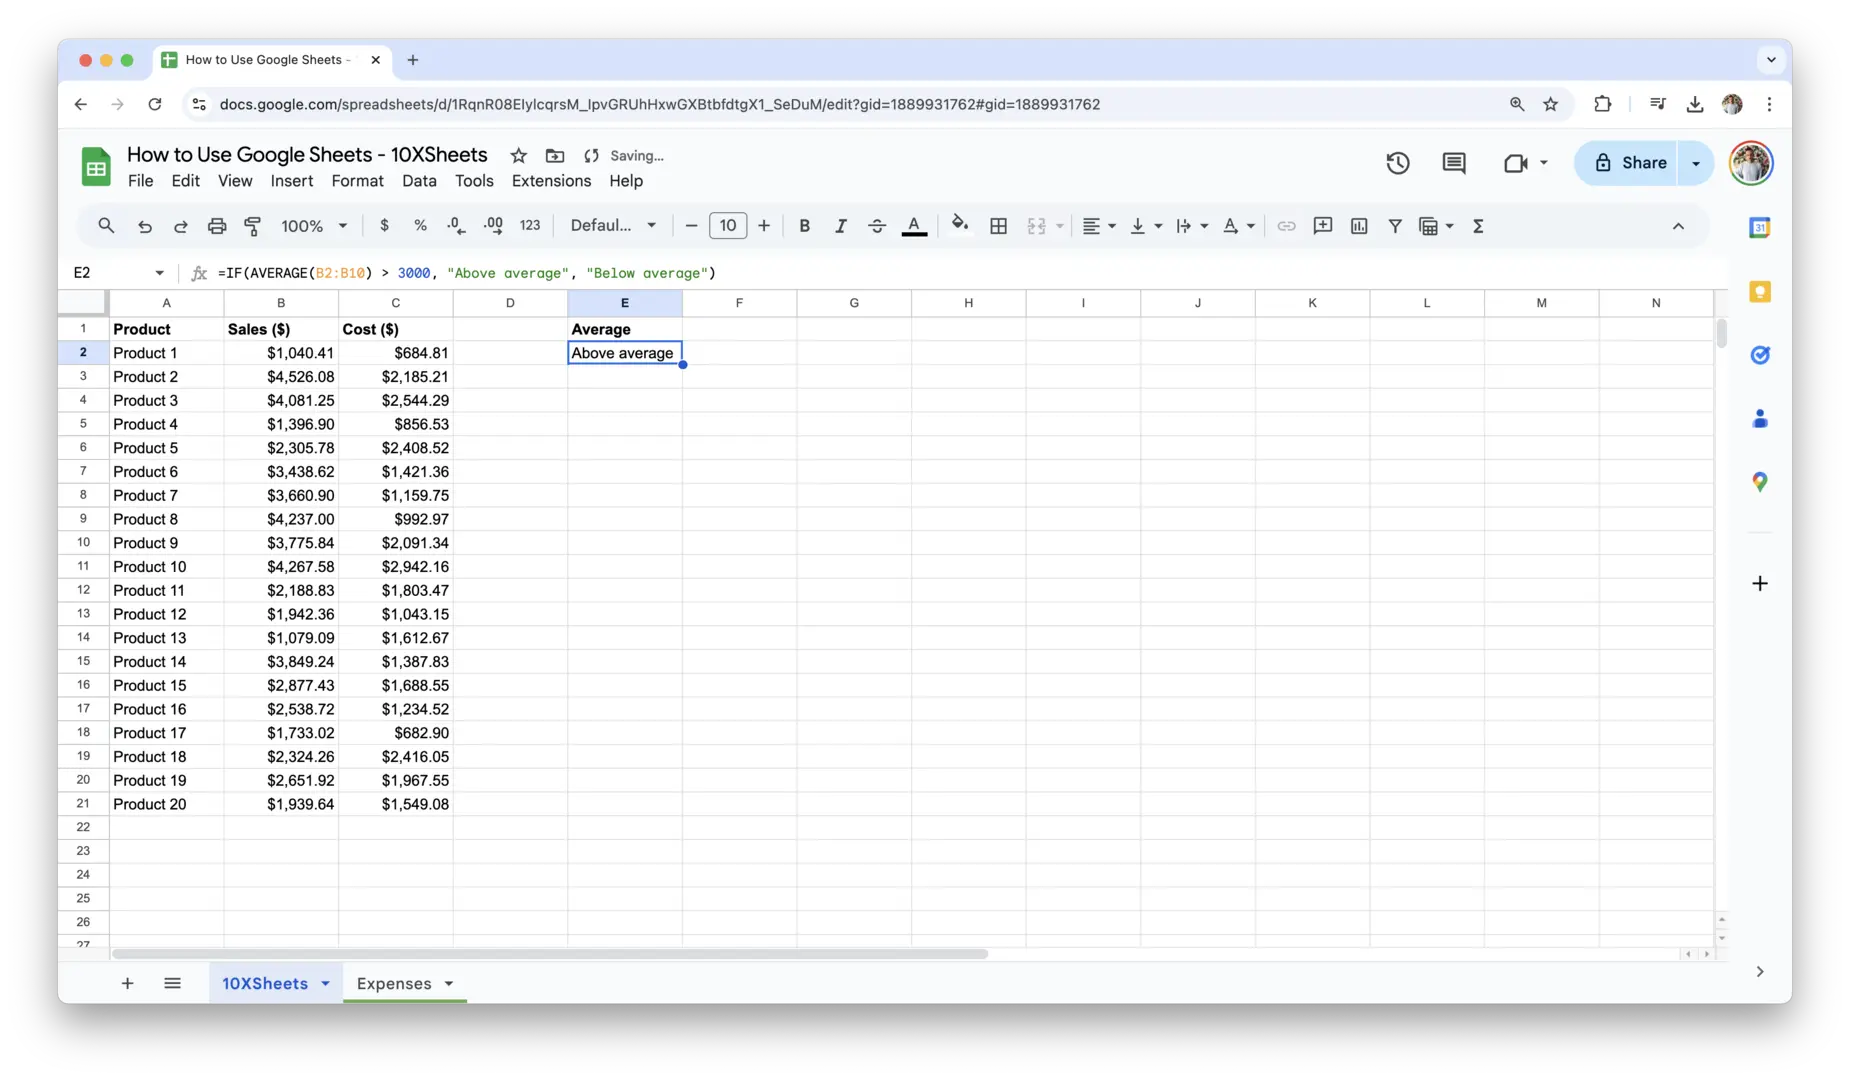
In this example, the AVERAGE() function is nested inside the IF() function, meaning that if the average of cells B2 through B10 is greater than 3000, the formula will return “Above average”; otherwise, it will return “Below average.”
Logical functions, such as IF(), AND(), OR(), and NOT(), are often used in conjunction with nested formulas. These functions allow you to test multiple conditions and perform actions based on the outcome. For instance, the AND() function can check whether two or more conditions are true at the same time:
=IF(AND(B2 > 2500, C2 < 1500), "Valid", "Invalid")
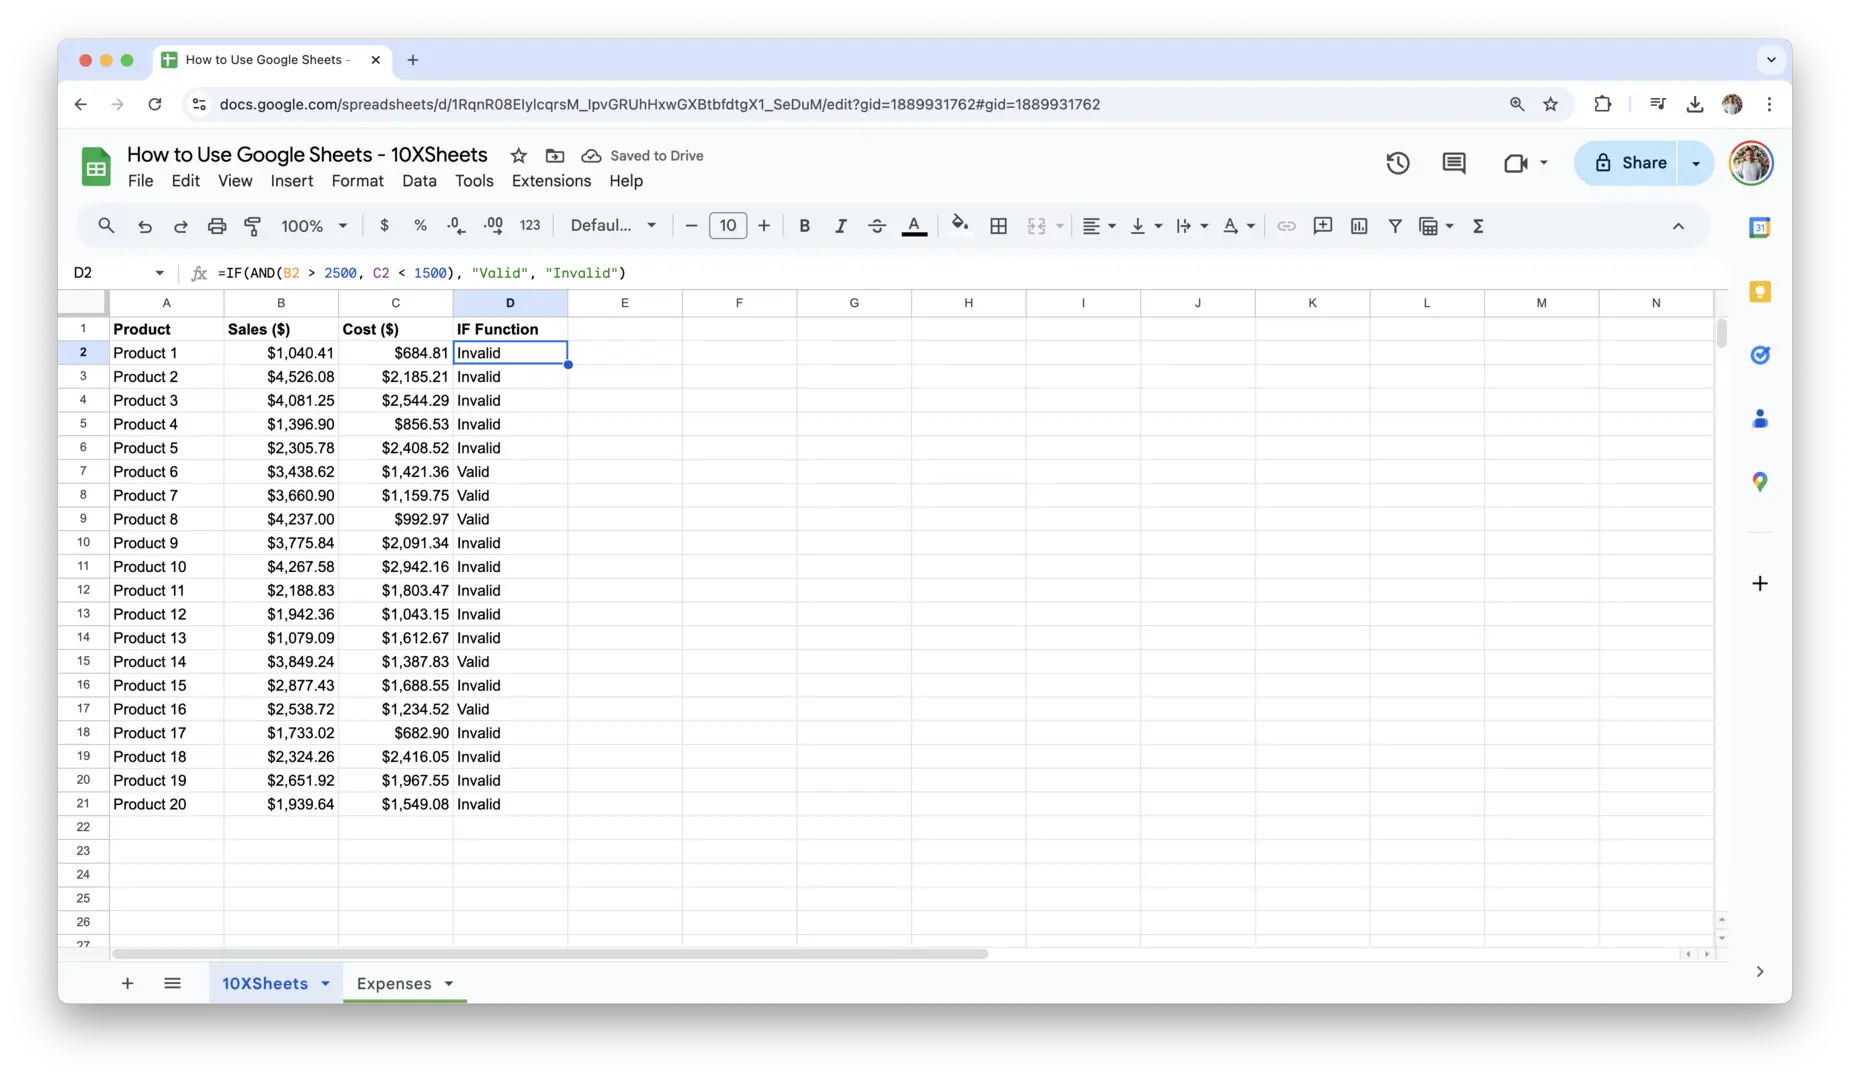
This formula will return “Valid” only if both conditions—B2 being greater than 2500 and C2 being less than 1500—are true.
Lookup Functions
The lookup functions in Google Sheets are incredibly useful for searching through data and finding specific values. Two of the most commonly used lookup functions are VLOOKUP() and HLOOKUP().
- VLOOKUP() is used when you need to search for a value in the first column of a range and return a corresponding value from another column in the same row.
=VLOOKUP("Apple", A2:B10, 2, FALSE)This will search for the word “Apple” in the range A2:A10 and return the corresponding value from column B.
- HLOOKUP() works similarly to VLOOKUP, but instead of searching vertically, it searches for a value in the first row and returns a value from the corresponding row.
=HLOOKUP("January", A1:F1, 2, FALSE)This will search for the word “January” in the first row and return the value from the second row.
You can also use INDEX() and MATCH() together as a more flexible alternative to VLOOKUP or HLOOKUP, as they allow you to search any column or row, not just the first one.
=INDEX(B2:B10, MATCH("Apple", A2:A10, 0))
This formula searches for “Apple” in column A and returns the corresponding value from column B.
Text Functions for String Manipulation
When working with data that includes text, text functions are essential for cleaning, organizing, and manipulating that information. Google Sheets offers several built-in functions for handling text.
- CONCATENATE(): Joins two or more strings of text together.
Example:=CONCATENATE(A1, " ", B1)combines the text in cells A1 and B1 with a space between them. - TEXT(): This function is used to format a number or date as text.
Example:=TEXT(A1, "mm/dd/yyyy")formats a date in cell A1 as “month/day/year.” - LEFT() and RIGHT(): These functions extract a specified number of characters from the beginning or end of a string.
Example:=LEFT(A1, 3)will return the first three characters of the text in A1. - FIND() and SEARCH(): Both functions are used to find the position of a substring within a string.
Example:=FIND("apple", A1)will return the position where the word “apple” first appears in the text in cell A1.
Date and Time Functions
Working with dates and times is another key area where Google Sheets shines. The following date and time functions help you manipulate, calculate, and format time-based data.
- TODAY(): Returns the current date.
=TODAY() - NOW(): Returns the current date and time.
=NOW() - DATEDIF(): Calculates the difference between two dates. You can specify whether you want the result in years, months, or days.
=DATEDIF(A1, B1, "Y") - DATE(): Creates a date from year, month, and day values.
=DATE(2025, 12, 25) - YEAR(), MONTH(), DAY(): These functions extract specific parts of a date.
=YEAR(A1), =MONTH(A1), =DAY(A1)
These date and time functions are incredibly helpful for tracking deadlines, calculating time intervals, or formatting dates in the exact way you need them.
Organizing and Analyzing Google Sheets Data
Google Sheets offers a variety of tools to help you organize and analyze large amounts of data efficiently. Whether you’re summarizing data, visualizing trends, or validating inputs, these features make working with spreadsheets more powerful and insightful.
Sorting and Filtering Data
Sorting and filtering your data can make it much easier to view specific information and find trends. You can sort data alphabetically, numerically, or by custom criteria, making it easier to spot important patterns.
- Sorting: Select the range of cells you want to sort, then click Data > Sort range. You can choose to sort by specific columns in ascending or descending order, making it easier to rank data.
- Filtering: Filters allow you to display only the data that meets certain criteria. You can apply a filter by clicking the Filter button in the toolbar or by selecting Data > Create a filter. Filters are particularly useful when working with large datasets, as they allow you to view only the rows that match your specific conditions.
Grouping and Summarizing Data with Pivot Tables
Pivot tables are one of the most powerful features in Google Sheets for summarizing and analyzing data. They allow you to quickly aggregate large datasets and find trends, averages, and totals.
To create a pivot table:
- Select your data range.
- Go to Data > Pivot table.
- In the pivot table editor, choose which fields you want to display as rows, columns, values, and filters.
For example, if you have sales data, you can use a pivot table to group sales by product and calculate the total sales for each product. You can also apply filters to analyze specific date ranges or regions.
Using Charts and Graphs for Data Visualization
Charts and graphs are essential for turning your data into visual insights. Google Sheets offers a variety of chart types to help you present your data in a clear and digestible format.
- Bar Charts: Useful for comparing values across categories.
- Line Graphs: Great for visualizing trends over time.
- Pie Charts: Ideal for showing how parts of a whole compare to each other.
To create a chart, select the data you want to visualize, click Insert > Chart, and choose the chart type that best represents your data. You can also customize the chart’s appearance by changing its colors, labels, and axes.
Data Validation for Controlled Input
Data validation is essential when you want to restrict the type of data entered into a cell, ensuring that users input information in the correct format. You can use data validation to create drop-down menus, restrict input to numbers only, or enforce specific rules.
For example, if you’re creating a survey or form and want respondents to select a value from a list, you can set up a drop-down menu:
- Select the cells where you want the drop-down.
- Go to Data > Data validation.
- Choose List of items and enter the values you want to appear in the drop-down.
This helps ensure that users only enter valid data and reduces the likelihood of errors.
Google Sheets Collaboration Features
Google Sheets is built for collaboration. With a few simple tools, you can share your sheet with others, leave comments, track changes, and ensure everyone stays on the same page.
Sharing and Setting Permissions for Collaborators
Google Sheets makes it easy to collaborate with others in real time. To share your sheet, click the Share button in the top-right corner. You can choose to share the document with specific people via email, or create a link that anyone can use to access the sheet.
You can also control the level of access others have by setting permissions. You can choose whether they can edit, comment, or view the sheet. For example, if you’re collaborating with a team but don’t want them to make changes, you can give them view-only access while allowing them to comment.
Adding Comments and Suggestions
Adding comments is a great way to provide feedback or ask questions without changing the content of the sheet. To add a comment, simply right-click a cell and select Insert comment. You can then type your comment and tag specific collaborators by using @ followed by their name.
If you want someone to review a change or suggestion before making it, you can use suggestion mode. This allows collaborators to suggest edits that can be accepted or rejected.
Version History and Recovering Previous Versions
Google Sheets automatically saves your progress, but if you need to go back to an earlier version, you can use the Version history feature. Click File > Version history > See version history to see all changes made over time. You can view previous versions, restore an older version, or compare changes between different versions.
Using Google Sheets with Google Forms for Data Collection
Google Sheets integrates seamlessly with Google Forms, making it easy to collect and organize responses. When you create a Google Form, the responses can automatically populate a Google Sheet, allowing you to track answers in real time.
To set up the integration, simply create your Google Form and then click on Responses > Create Spreadsheet. This will create a new sheet that automatically updates whenever a new form response is submitted.
These collaboration features allow you to work efficiently with your team, track progress, and make changes in real time. Whether you’re editing a budget, analyzing data, or managing a project, Google Sheets’ collaboration tools will help keep everyone aligned and productive.
Google Sheets Automation and Integration
One of the greatest advantages of using Google Sheets is its ability to integrate with other tools and automate tasks, saving you time and effort. From automating repetitive tasks to connecting Google Sheets with external platforms, these features allow you to streamline your workflow and make your data management process even more powerful.
- Google Sheets Add-ons: You can extend the functionality of Google Sheets by installing add-ons from the Google Workspace Marketplace. These add-ons help with everything from project management to financial analysis and can integrate Google Sheets with other platforms like Salesforce, QuickBooks, or Asana. Adding an add-on is easy—just click Add-ons in the menu, select Get add-ons, and browse the available options.
- Google Apps Script: For more advanced automation, Google Apps Script allows you to write custom code to automate tasks, such as sending emails, creating reports, or updating data across multiple sheets. You can access the script editor by clicking Extensions > Apps Script. This is especially useful if you need to automate processes that go beyond the standard functions or add-ons.
- Zapier Integration: With Zapier, you can connect Google Sheets to over 2,000 other apps without needing to write any code. This allows you to automate workflows between your favorite tools. For example, you could set up a “Zap” to automatically add new form responses to a Google Sheet or update a sheet every time you get a new email in Gmail.
- Google Forms Integration: Google Sheets can seamlessly integrate with Google Forms. When you collect responses through a Google Form, the data is automatically populated in a linked Google Sheet. This is especially helpful for surveys, event sign-ups, and other types of data collection where you want real-time updates in your sheet without manual entry.
- External API Integration: You can also integrate Google Sheets with external APIs to fetch live data from other services. For instance, you could pull in stock market data, weather forecasts, or even social media statistics directly into your sheet, updating it automatically with the latest information. This is achieved by using the IMPORTDATA(), IMPORTXML(), or IMPORTJSON() functions, depending on the type of data you’re working with.
By integrating automation tools and external systems, you can create a truly dynamic and efficient workflow in Google Sheets.
Google Sheets Best Practices for Efficiency
Optimizing your Google Sheets usage can significantly boost your productivity. With a few key strategies, you’ll be able to work faster, reduce errors, and keep your spreadsheets well-organized. Here are some best practices to help you get the most out of Google Sheets.
- Use Keyboard Shortcuts: Learning a few essential keyboard shortcuts can save you a lot of time. For example, use Ctrl + C (Cmd + C on Mac) to copy, Ctrl + V (Cmd + V on Mac) to paste, and Ctrl + Z (Cmd + Z on Mac) to undo. Google Sheets offers a variety of shortcuts for navigation, formatting, and data entry, which can make your work much faster.
- Organize Your Data with Named Ranges: If you work with complex formulas or large datasets, consider using named ranges for your key data areas. Instead of referencing cell ranges like A1:A10, you can name that range something like “SalesData” and refer to it in your formulas, which makes them easier to understand and manage.
- Use Templates for Repetitive Tasks: If you frequently create similar types of spreadsheets (e.g., monthly reports, budgets, or invoices), consider creating a template. This will allow you to save time by reusing the same format and structure for each new document. You can create and save templates directly in Google Sheets, or find pre-built ones in the Google Sheets Template Gallery.
- Keep Your Sheets Clean and Simple: It’s easy for a spreadsheet to become cluttered, especially when working with large datasets. To keep your sheet efficient, avoid unnecessary formatting, excessive formulas, or too many sheets. Only include the information you truly need and use clear headings, colors, or borders to help organize the data.
- Use Data Validation to Prevent Errors: Data validation is an effective way to ensure that the data entered into your sheet is accurate and follows the correct format. You can set rules for input types, such as allowing only numbers, dates, or selections from a drop-down list. This can help prevent mistakes that might arise from manual data entry.
- Use Filters and Conditional Formatting for Quick Analysis: Filters help you quickly sort through large datasets to focus on the most relevant information. Similarly, conditional formatting allows you to automatically highlight important values or trends, such as sales figures above a certain threshold or dates that are approaching.
- Break Large Sheets into Smaller, Manageable Ones: If your sheet is becoming too large and difficult to navigate, consider splitting it into multiple, smaller sheets. You can use one sheet for data input, another for analysis, and a third for reporting, for example. This way, each sheet is easier to work with, and you can also organize related data together.
- Leverage Pivot Tables for Summarizing Data: Pivot tables are an excellent tool for summarizing and analyzing large datasets quickly. By dragging and dropping fields into a pivot table, you can group data by categories, perform calculations like sums and averages, and get a bird’s-eye view of key trends. This makes them a must-have tool for analyzing complex data.
- Collaborate Efficiently with Comments and Notes: When working with teams, it’s important to leave comments or notes on cells where clarification is needed. Rather than sending emails or making phone calls, you can leave contextual feedback directly within the sheet. This keeps everything in one place and ensures that everyone is on the same page.
- Regularly Clean Up Your Sheets: Over time, your sheet may accumulate unnecessary data, outdated information, or redundant calculations. Make it a habit to periodically review and clean up your sheets by removing unused data, consolidating similar sheets, and ensuring your formulas are working properly.
By following these best practices, you’ll be able to maximize your efficiency in Google Sheets, whether you’re working on personal projects, business tasks, or collaborative efforts.
Conclusion
By now, you should have a solid understanding of how to use Google Sheets for a wide variety of tasks. From creating and organizing your data to using powerful formulas, charts, and collaboration tools, Google Sheets offers a range of features that can help you work smarter. Whether you’re handling personal finances, managing a team project, or analyzing business data, the tools and techniques covered in this guide will make your work more efficient and organized. The best part is that Google Sheets is flexible and scalable, meaning you can apply the skills you’ve learned to any type of project, large or small.
Don’t hesitate to experiment with the features that interest you most. The more you practice, the more comfortable you’ll become with using Google Sheets in your daily tasks. With its simple yet powerful tools, Google Sheets is designed to help you get things done without the complexity of other spreadsheet software. So go ahead, create a new sheet, explore different functions, and discover new ways to make your data work for you. It’s all there for you to try!
Get Started With a Prebuilt Template!
Looking to streamline your business financial modeling process with a prebuilt customizable template? Say goodbye to the hassle of building a financial model from scratch and get started right away with one of our premium templates.
- Save time with no need to create a financial model from scratch.
- Reduce errors with prebuilt formulas and calculations.
- Customize to your needs by adding/deleting sections and adjusting formulas.
- Automatically calculate key metrics for valuable insights.
- Make informed decisions about your strategy and goals with a clear picture of your business performance and financial health.


