Are you looking for the best data analysis software to help you make smarter business decisions? With so many options available, it can be tough to know where to start. Whether you’re handling large datasets, creating insightful reports, or predicting future trends, the right data analysis tool can make all the difference. The key is finding software that fits your needs, skill level, and budget.
In this guide, we’ll explore some of the top data analysis tools, breaking down their features and helping you understand what makes each one unique. From user-friendly platforms for beginners to advanced solutions for data scientists, there’s something for everyone, and we’re here to help you find the perfect fit.
What is Data Analysis Software?
Data analysis software refers to tools designed to help businesses and organizations process, interpret, and visualize large sets of data. These tools play a critical role in transforming raw data into actionable insights, supporting decision-making, and driving business growth. Whether you’re analyzing sales data, customer behavior, or operational metrics, data analysis software streamlines the process, making it more efficient and accurate.
Importance of Data Analysis in Today’s Business Landscape
- Informed Decision-Making: Data-driven insights allow businesses to make more informed, fact-based decisions rather than relying on guesswork or intuition.
- Competitive Advantage: By leveraging data analysis, businesses can uncover trends and patterns that help them stay ahead of the competition.
- Improved Efficiency: Data analysis software automates processes, reducing the time spent on manual tasks and allowing teams to focus on strategic initiatives.
- Personalized Customer Experiences: Analyzing customer data enables businesses to tailor products, services, and marketing strategies to meet the specific needs and preferences of their audience.
- Predictive Capabilities: Advanced data analysis tools allow businesses to predict future trends, helping them plan and respond proactively to changing market conditions.
What Data Analysis Software Can Offer
Data analysis software offers a wide range of functionalities to enhance the way organizations work with data. From basic data processing to advanced predictive analytics, these tools support various aspects of the data lifecycle:
- Data Processing and Cleaning: Software helps to clean and format data, ensuring it’s ready for analysis.
- Statistical Analysis: It can perform statistical tests, identify correlations, and model data to uncover insights.
- Visualization Tools: Data can be turned into interactive charts, graphs, and dashboards, making it easier to understand complex information.
- Predictive Analytics: Some tools integrate AI and machine learning to predict future trends based on historical data.
- Reporting: Automated reports can be generated for decision-makers to understand data at a glance, saving time on manual report creation.
By providing these capabilities, data analysis software enables organizations to process data more efficiently, generate meaningful insights, and support strategic goals.
Why Choosing the Right Software is Crucial for Data-Driven Decision-Making?
- Accuracy of Insights: The quality of the insights you derive from data directly depends on the capabilities of your software. The wrong tool may result in inaccurate or incomplete analysis.
- Speed and Efficiency: The right software helps speed up data processing, enabling faster decision-making. In today’s fast-paced business environment, efficiency is key to staying competitive.
- Scalability: As your business grows, the volume of data you handle will increase. The right software ensures that it can scale with your data needs without sacrificing performance.
- User Adoption: If the software is too complicated or doesn’t meet your team’s needs, you’ll struggle with adoption. The right software will be intuitive, enabling your team to start generating valuable insights immediately.
- Cost-Effectiveness: Choosing software that fits both your needs and budget ensures you get the best return on investment, without overspending on features you don’t need.
Top Data Analysis Software
The data analysis software market is diverse, offering a wide range of tools that cater to different industries, business needs, and team capabilities. From simple platforms designed for small businesses to advanced systems tailored for large enterprises, the options are abundant. Choosing the right tool depends on your organization’s specific requirements, such as the volume of data, the complexity of analysis, and the level of expertise within your team. Below are some of the top data analysis software solutions that have proven themselves as leaders in the field.
Tableau
Tableau is one of the most popular data visualization tools on the market. It is known for its intuitive, drag-and-drop interface that makes it easy to create complex visualizations without requiring advanced technical skills. Tableau allows users to connect to various data sources, such as spreadsheets, databases, and cloud services, to pull in data and immediately start building visual reports. It’s especially useful for businesses that need to analyze large datasets and present the findings in a visually compelling way to stakeholders.
Tableau offers an extensive library of visualization options, from basic charts to more sophisticated maps and scatter plots, making it a versatile tool for data exploration. The software also supports real-time data analysis, ensuring that the visualizations are always up to date with the latest information. Tableau’s advanced features, such as predictive analytics and dashboard customization, make it a great choice for organizations looking to harness the full power of their data. While it is user-friendly, Tableau’s pricing model can be expensive for smaller businesses, which may limit its accessibility for some.
Microsoft Power BI
Microsoft Power BI is another heavyweight in the world of data analysis software, especially popular for businesses already within the Microsoft ecosystem. With seamless integration into other Microsoft products like Excel, Azure, and Office 365, Power BI offers a low barrier to entry for companies that already use these tools. The software allows users to connect to a wide array of data sources, build powerful data models, and generate interactive reports and dashboards.
Power BI’s key strength lies in its affordability, especially for small to medium-sized businesses. It offers a free version with many of the core features needed for basic data analysis, and its paid plans are competitively priced compared to other software on the market. The platform is also highly scalable, making it suitable for both small teams and large enterprises. One of the main advantages of Power BI is its integration with Excel, allowing users to import and analyze data from Excel spreadsheets easily. However, while the tool is powerful, its interface can be a bit overwhelming for beginners, requiring some time to learn.
SAS
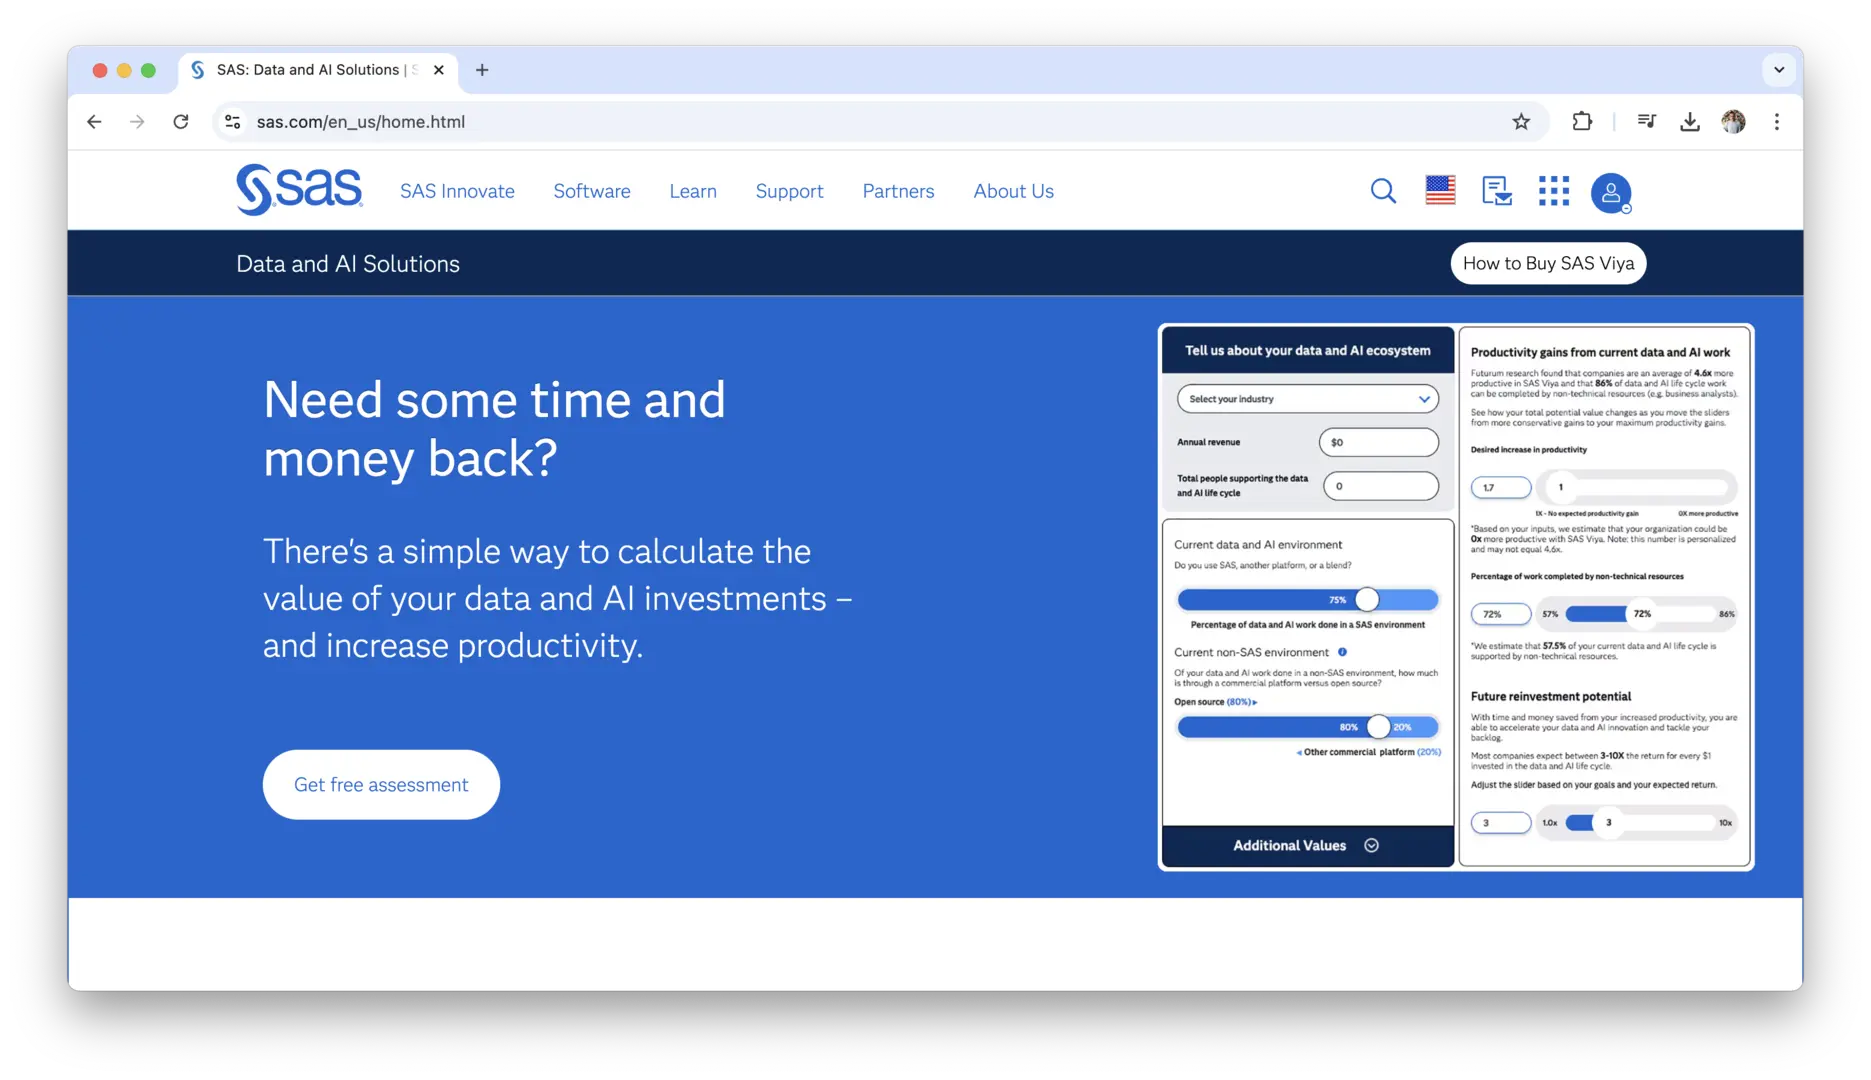
SAS (Statistical Analysis System) is a comprehensive data analytics platform that is particularly favored by enterprises with complex data needs. It has been around for decades and is well-known for its robust capabilities in statistical analysis, predictive analytics, and data management. SAS is used across a wide variety of industries, including healthcare, finance, and government, due to its advanced analytical capabilities and compliance with industry standards.
SAS offers tools for data mining, machine learning, and statistical analysis, enabling businesses to extract deeper insights from large datasets. The platform’s ability to handle structured and unstructured data makes it an ideal solution for organizations that deal with complex data types. One of the biggest selling points of SAS is its strong focus on security and regulatory compliance, making it a go-to choice for industries where data privacy is a concern. However, its pricing structure can be prohibitive for smaller businesses, and its user interface is less intuitive than some of the other tools on the market, making it more suitable for advanced data analysts.
R
R is a free, open-source programming language and software environment used primarily for statistical computing and graphics. Unlike other data analysis software, R is a programming language, which means it requires some level of coding knowledge. However, R’s flexibility and vast array of libraries make it incredibly powerful for those who have the technical expertise to use it. It’s especially popular in academia and research fields, as it can handle complex statistical analyses and data visualizations with ease.
R’s capabilities include data manipulation, statistical modeling, and machine learning, making it an ideal tool for users who need more control over their analysis. It’s also an excellent choice for businesses that need to implement custom analytical models or integrate advanced statistical techniques into their analysis. Because it is open-source, R is completely free to use, though it does require a steep learning curve compared to more user-friendly platforms. R has an active community of developers who continuously update its vast repository of packages, making it one of the most versatile data analysis tools available.
Python with Pandas
Python, in combination with the Pandas library, is another powerful open-source solution for data analysis, widely used by data scientists and analysts who need to handle large datasets, perform complex analysis, and visualize results. Python is a general-purpose programming language that is popular in both the software development and data science communities, while Pandas provides a high-performance, easy-to-use data structure for handling and analyzing structured data.
Python’s versatility allows for deep integration with machine learning models, web development frameworks, and cloud-based platforms. It’s ideal for organizations that need to run custom data analysis or automate certain data workflows. Python also offers many other libraries, such as NumPy and Matplotlib, that can be used in tandem with Pandas to enhance your data analysis capabilities. The main downside of Python is that it requires coding skills, so it’s better suited for teams with technical expertise. However, the flexibility and depth of its capabilities make it an excellent choice for advanced users looking for a powerful, customizable tool.
Qlik Analytics
Qlik Analytics, formerly QlikView, is a data visualization and business intelligence tool that is known for its in-memory data processing capabilities, allowing users to analyze and explore data in real time. QlikView is especially suitable for organizations that need to generate interactive reports and dashboards quickly, as it provides drag-and-drop features to create visualizations and explore data without the need for complex queries.
Qlik Analytics offers powerful data compression and aggregation features, which can make it easier to work with large datasets. It also includes an associative model, which allows users to make connections between different data sources quickly, uncovering insights that may not be immediately obvious. One of the advantages of Qlik is its speed, particularly when working with large, complex datasets. However, Qlik has a steep learning curve for those new to data analysis tools, and its pricing structure can be complex, making it less accessible to small businesses.
Alteryx
Alteryx is a powerful data analytics platform that excels in data preparation, blending, and advanced analytics. It’s especially popular for teams that need to work with large datasets from multiple sources, providing a suite of tools that allow users to quickly clean, transform, and analyze data. Alteryx is designed to automate many of the time-consuming tasks involved in data processing, making it a great choice for businesses looking to speed up their data workflows.
Alteryx’s intuitive drag-and-drop interface makes it accessible for users without a technical background, while its advanced analytics capabilities, including predictive and spatial analytics, make it a go-to choice for more sophisticated analyses. One of its strengths is its integration with a wide variety of data sources, including cloud storage, databases, and third-party applications. The downside is that Alteryx’s pricing can be expensive for small businesses, but it offers great value for large teams and enterprises that require scalability.
Looker Studio
Looker Studio, previously Google Data Studio, is a free, cloud-based data visualization tool that allows users to create interactive dashboards and reports from data stored in Google Sheets, Google Analytics, and other Google services. Its primary appeal lies in its user-friendly interface and seamless integration with Google’s ecosystem of tools, making it an excellent choice for businesses already using Google products.
One of the standout features of Looker is its real-time collaboration capabilities, which allow teams to work together on the same report or dashboard. It also offers a wide range of customization options for creating visually appealing and informative reports. While it’s a powerful tool for basic to intermediate data analysis, it may not be as feature-rich as some of the more advanced options like Tableau or Power BI. However, for businesses that need a cost-effective, easy-to-use solution for data visualization, Looker Studio is a top contender.
TIBCO Spotfire
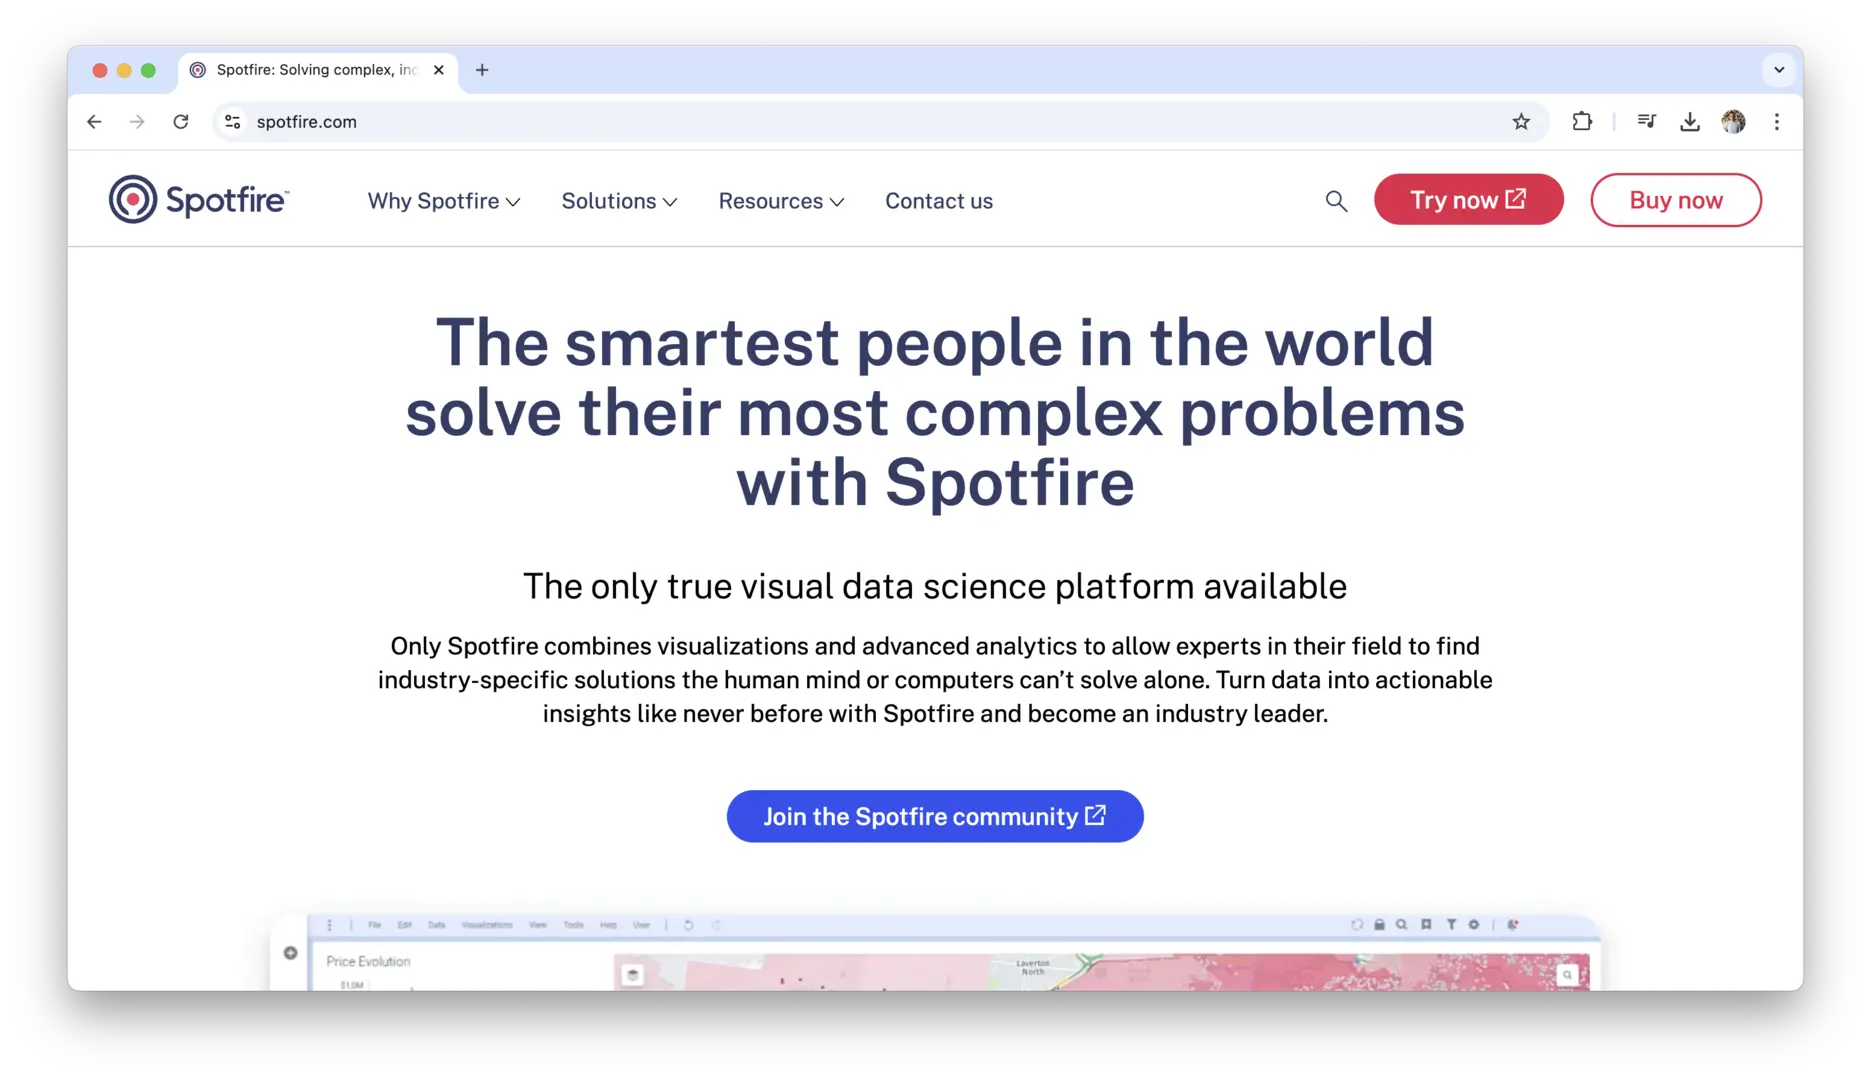
TIBCO Spotfire is a comprehensive analytics platform that specializes in data visualization, predictive analytics, and real-time analytics. Spotfire’s strength lies in its ability to help users quickly uncover insights through interactive visualizations, with a particular emphasis on exploration and data discovery. It is widely used by industries such as finance, healthcare, and manufacturing to analyze complex datasets and make data-driven decisions.
Spotfire supports both data wrangling and predictive modeling, offering users the ability to process raw data and apply machine learning algorithms directly within the platform. One of the key advantages of Spotfire is its strong integration capabilities, enabling seamless data access from various sources, including big data platforms and cloud storage. While Spotfire provides a robust set of features, its pricing may be a barrier for smaller companies, and its user interface can take time to master.
Zoho Analytics
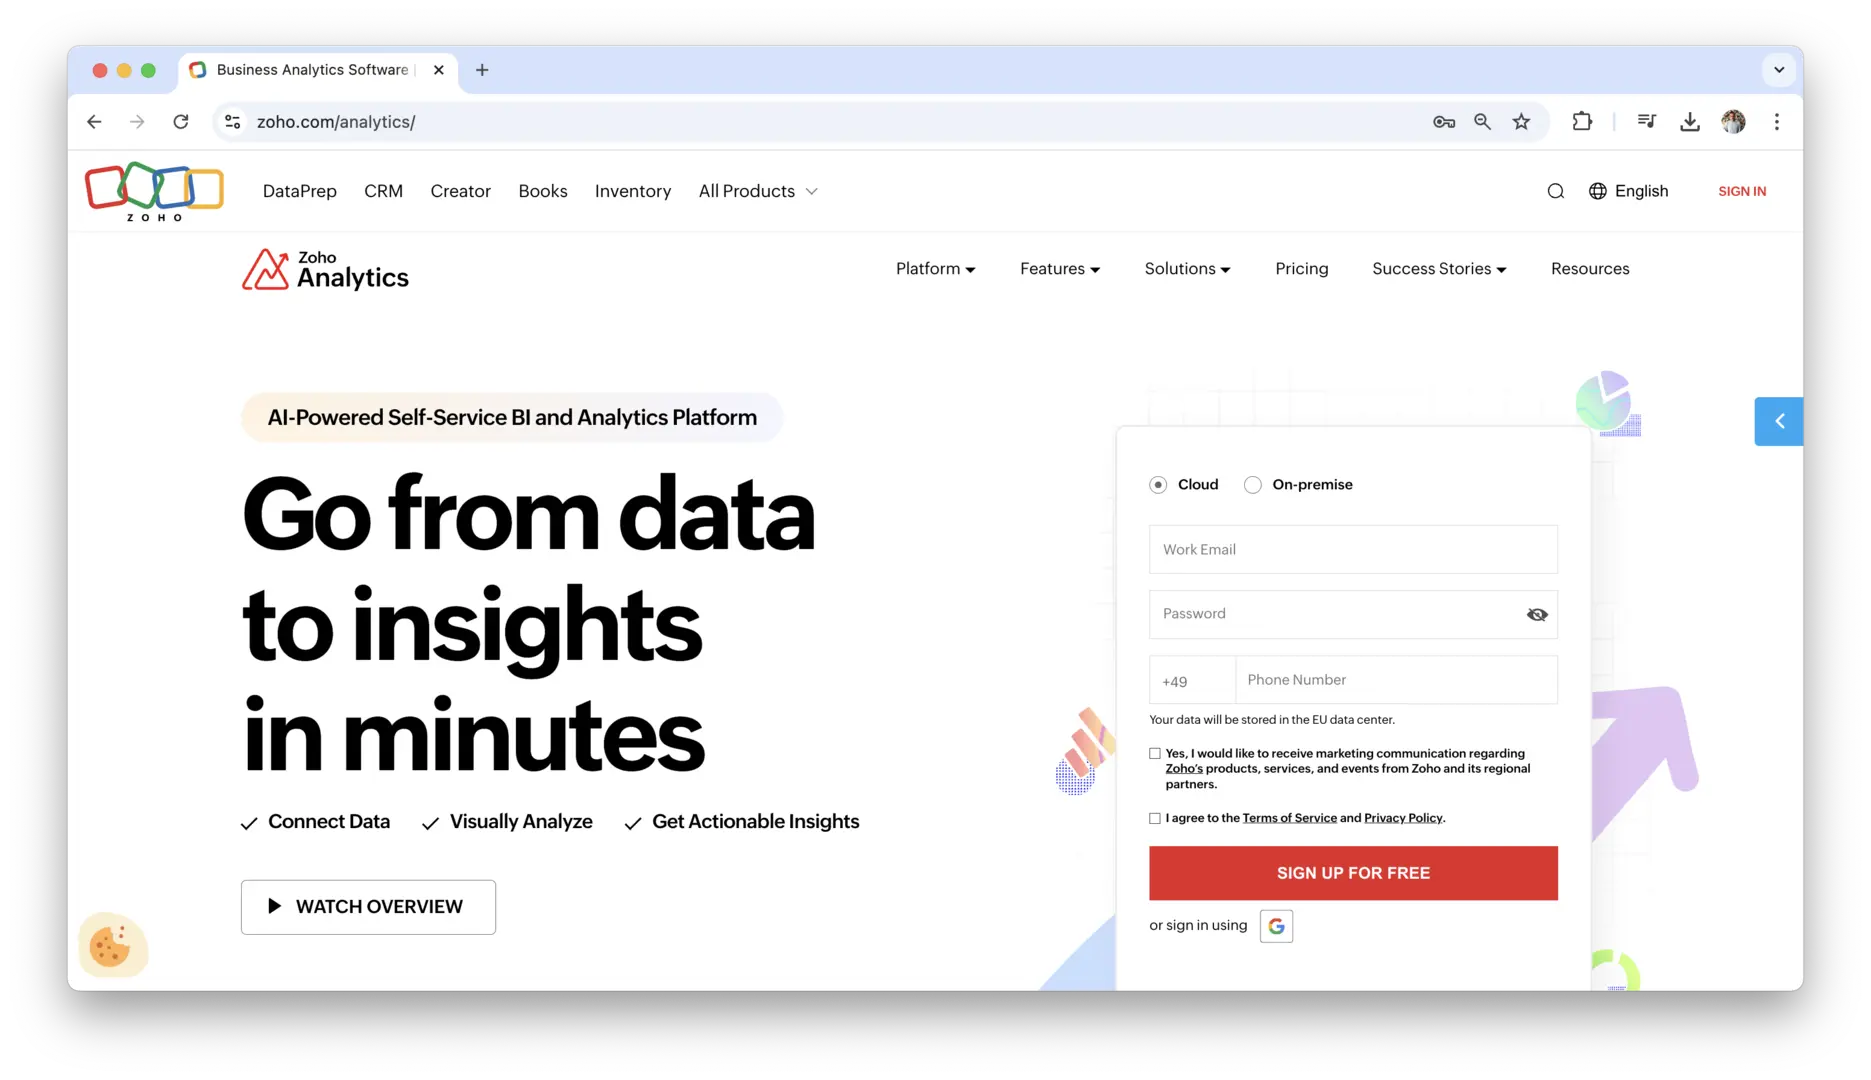
Zoho Analytics is a cloud-based business intelligence and data analysis tool that provides a full suite of features for data visualization, reporting, and analytics. It is part of the Zoho suite of applications, making it an attractive option for businesses already using other Zoho products, such as Zoho CRM or Zoho Projects.
Zoho Analytics offers an intuitive drag-and-drop interface for creating reports and dashboards, along with a wide array of pre-built templates. The platform also supports integration with a variety of data sources, from spreadsheets to cloud storage and third-party applications. One of the standout features is its advanced data blending capabilities, which allow users to combine data from different sources into a single report. Zoho Analytics is relatively affordable compared to other business intelligence platforms, making it a solid choice for small to medium-sized businesses.
Qlik Sense
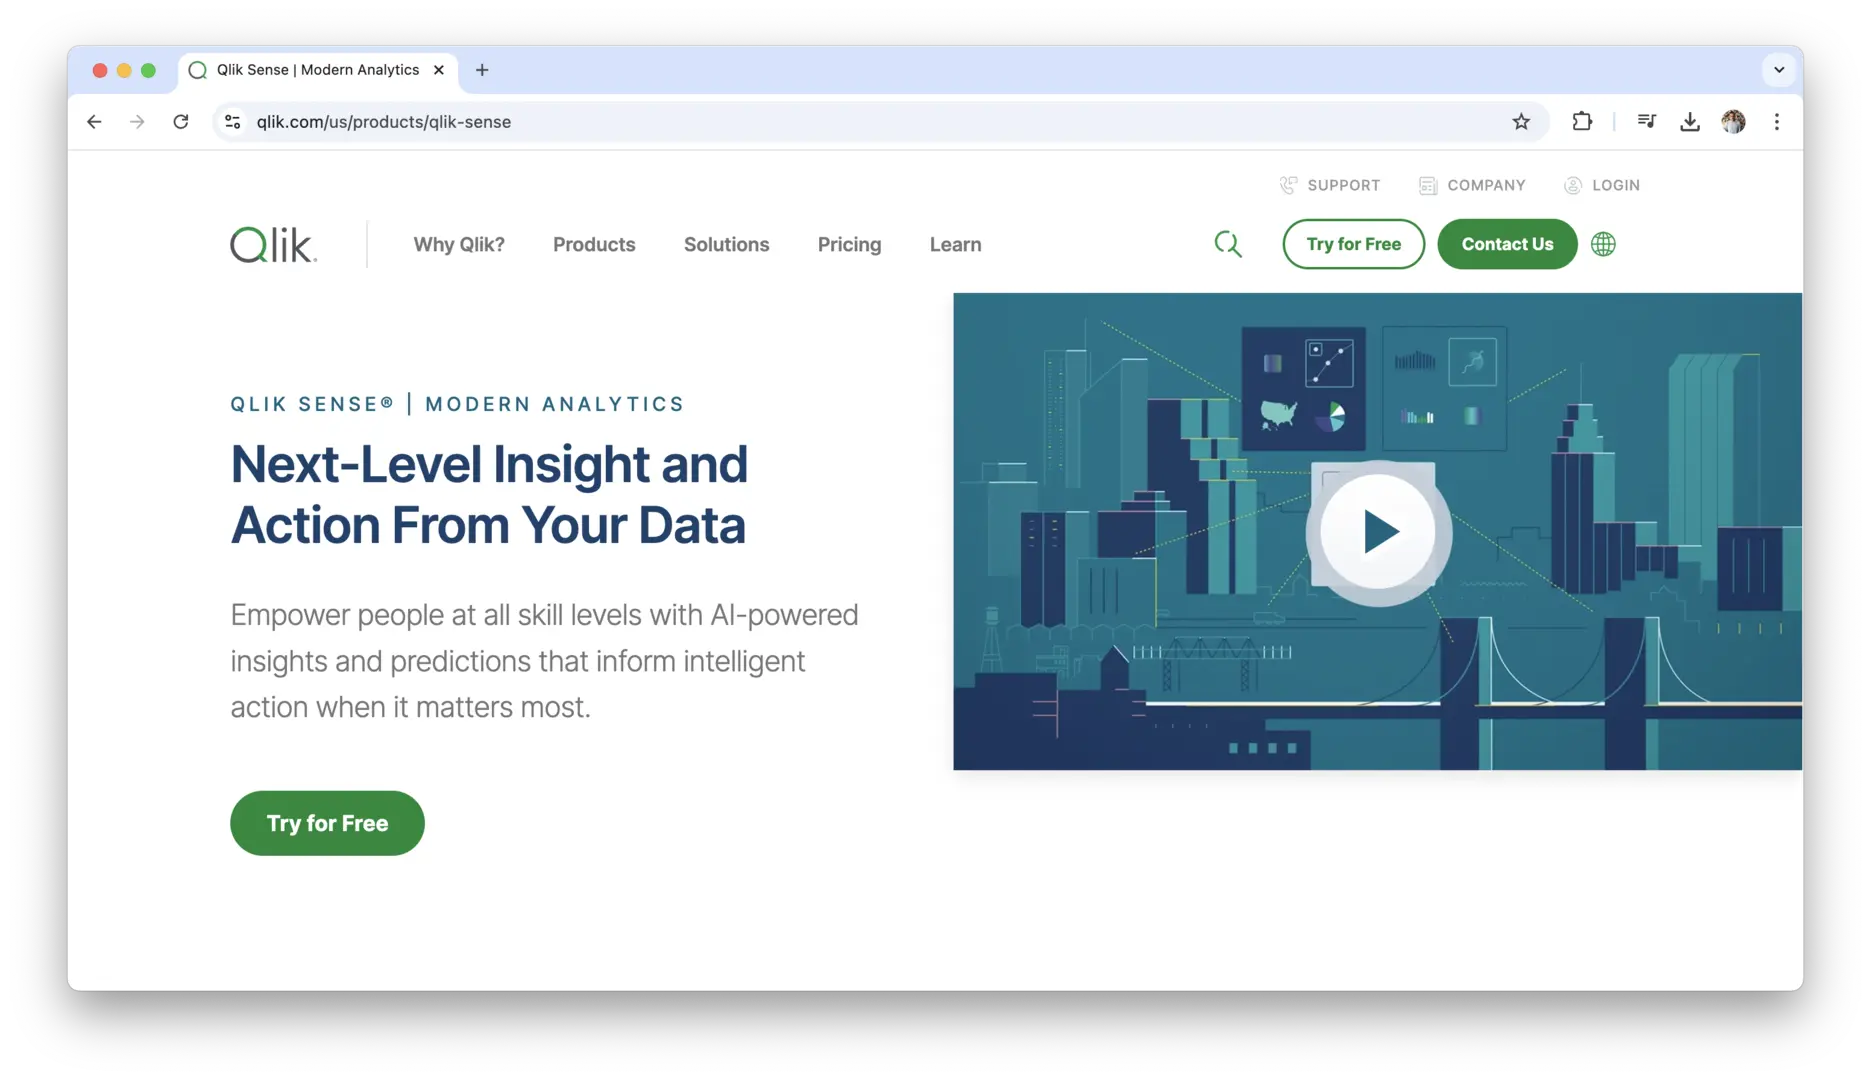
Qlik Sense is a data analytics platform known for its self-service data exploration and powerful visualization tools. Unlike other business intelligence tools that rely on predefined dashboards, Qlik Sense allows users to freely explore and interact with data in real time, making it an excellent choice for those who want to quickly generate insights on their own.
Qlik Sense’s associative model is one of its key features, allowing users to explore data from multiple angles and uncover hidden relationships. It also offers robust data storytelling capabilities, enabling users to create presentations that combine analysis with compelling visualizations. The platform is scalable, offering both cloud-based and on-premise solutions to meet the needs of businesses of all sizes. While Qlik Sense is a powerful tool, its learning curve can be steep for beginners, and its pricing may be prohibitive for smaller organizations.
IBM Watson Analytics
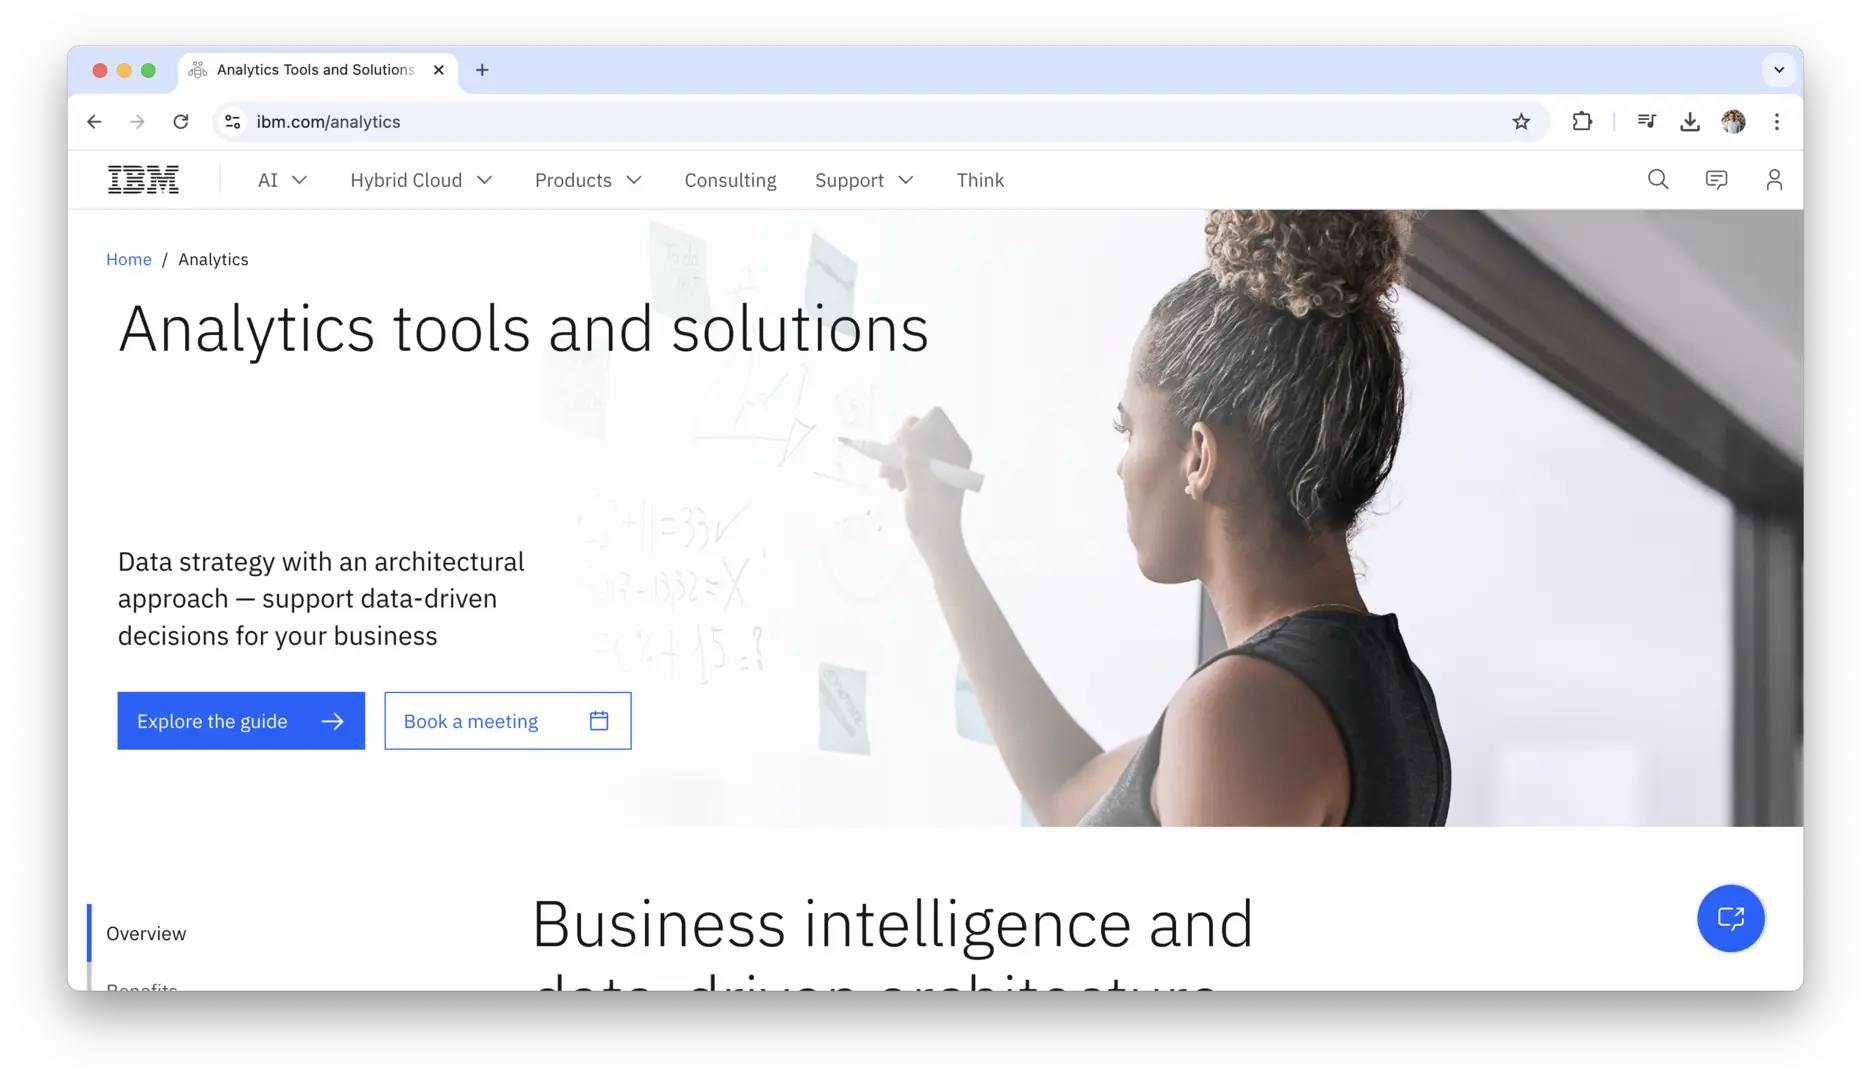
IBM Watson Analytics is an AI-powered data analysis tool that leverages IBM’s machine learning and cognitive computing capabilities to provide deep insights and predictive analytics. It offers an intuitive interface that allows users to ask questions in natural language and receive insights in the form of visualizations, charts, and reports.
Watson Analytics shines in its ability to automatically identify trends, correlations, and anomalies in data, making it a great tool for organizations looking to integrate AI into their data analysis process. The platform also offers robust data preparation, cleaning, and modeling features. However, while Watson Analytics is powerful, it can be more expensive than other tools, and its more advanced features may require technical expertise to fully leverage.
Domo
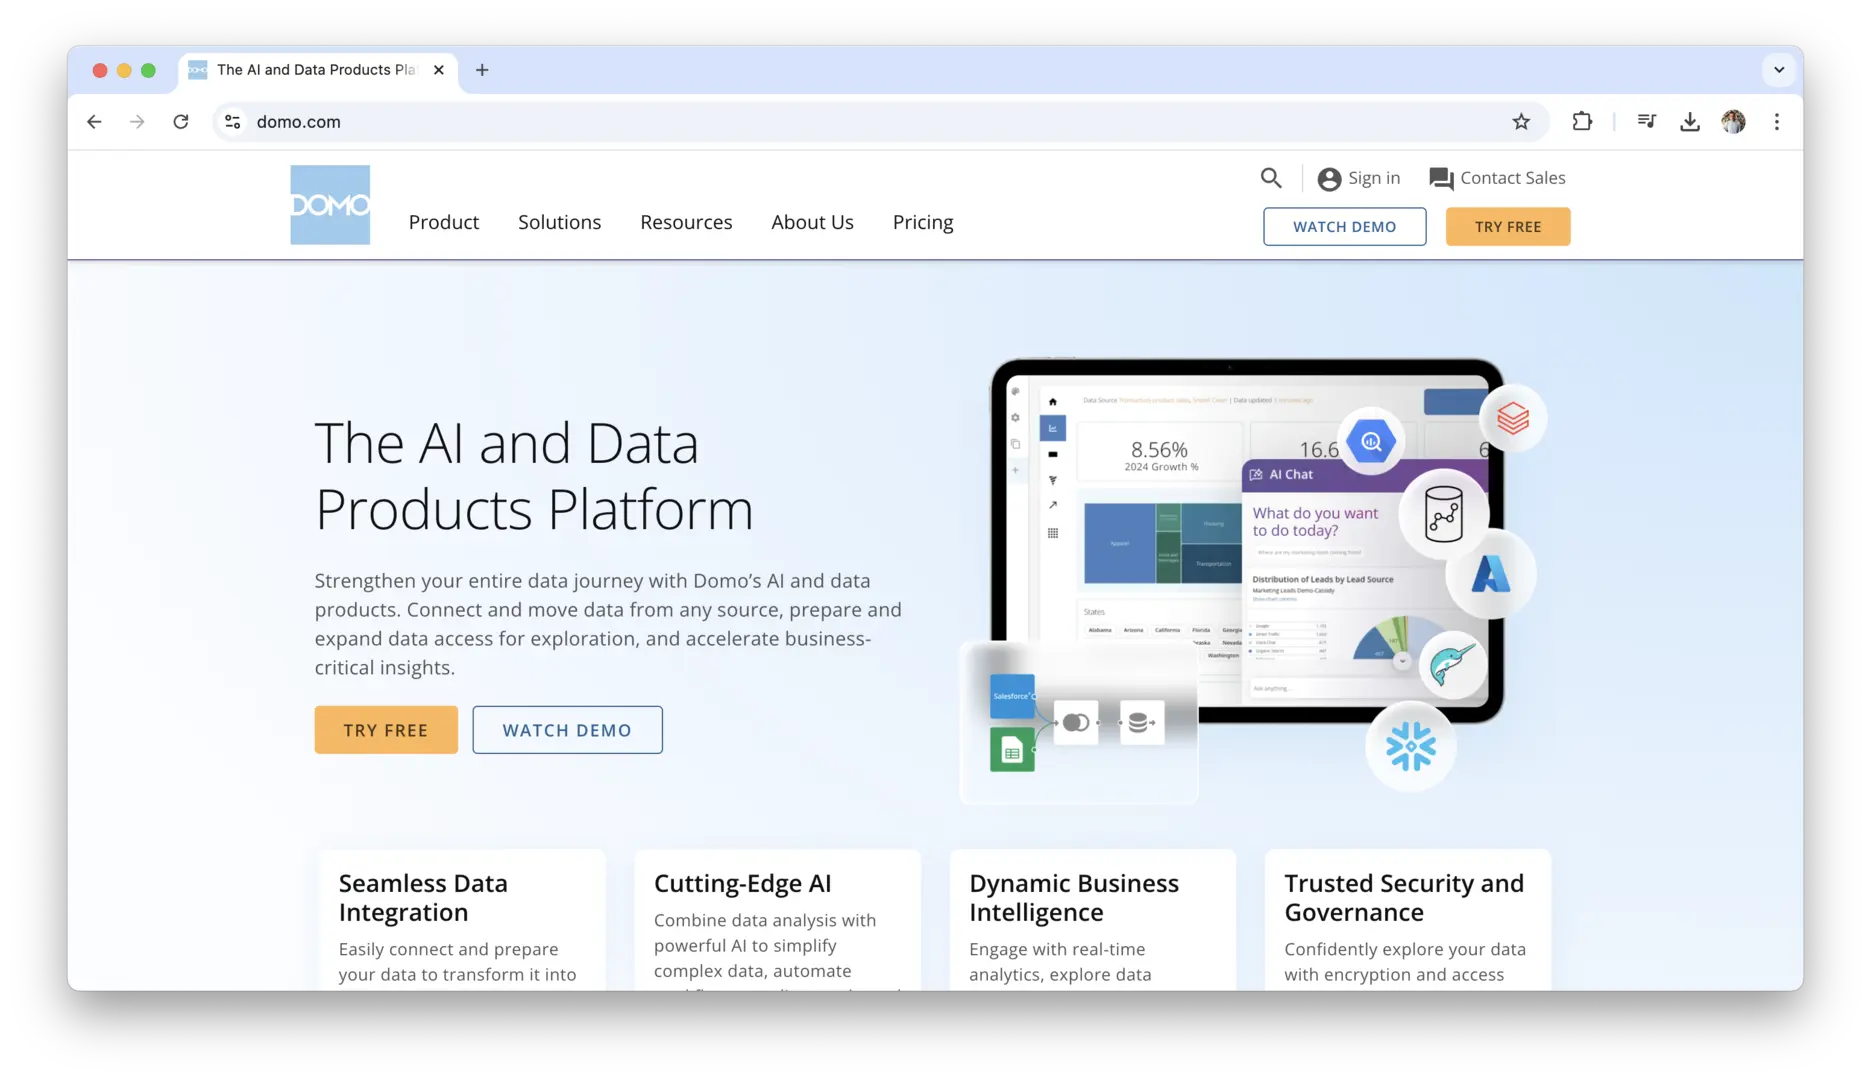
Domo is a cloud-based business intelligence platform that combines data integration, visualization, and analytics into a single solution. Domo is designed for companies that want to consolidate their data and generate real-time insights. The platform allows businesses to integrate data from a wide variety of sources, including social media, marketing platforms, sales data, and more.
Domo’s unique selling point is its scalability, making it suitable for both small businesses and large enterprises. It offers an easy-to-use interface with drag-and-drop functionality for creating reports and dashboards. One of Domo’s most appealing features is its mobile-friendly design, allowing users to access and interact with data on the go. While Domo is highly scalable, its pricing may be prohibitive for small businesses, and its advanced features may require additional training for users to master.
Sisense
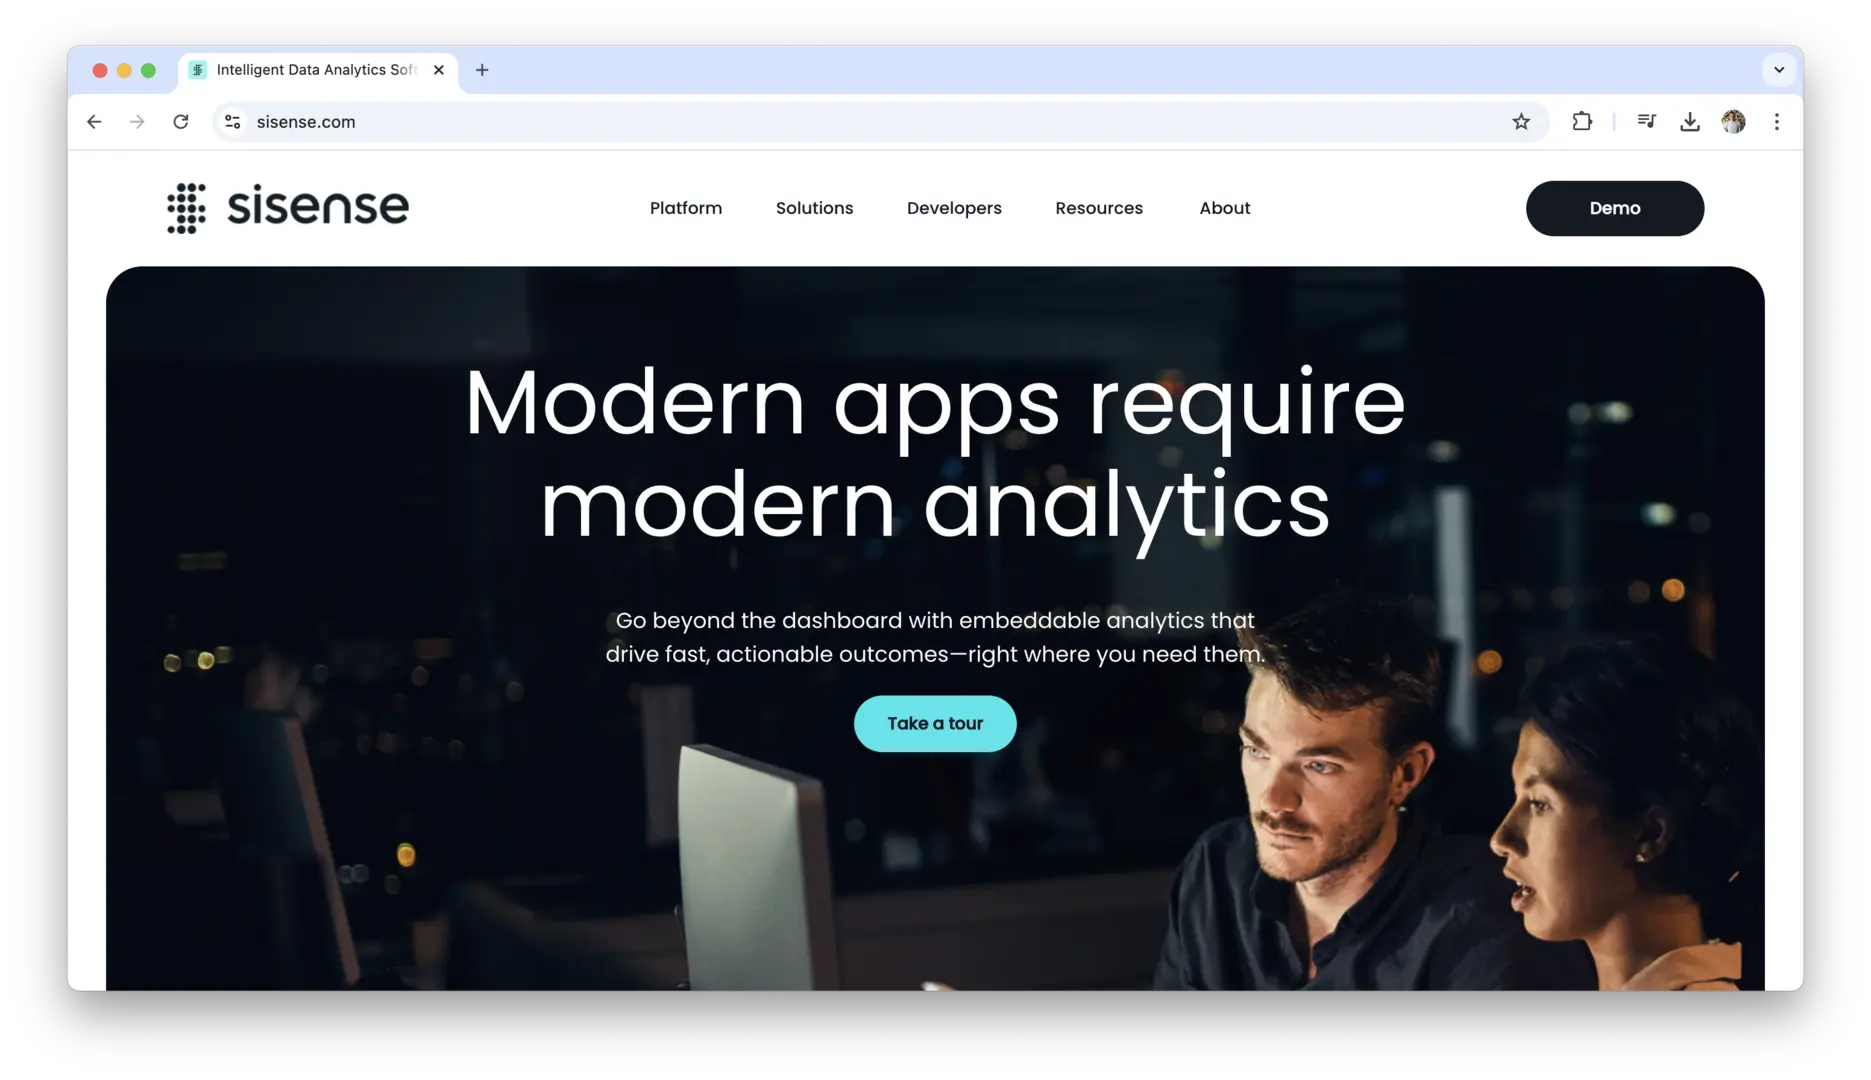
Sisense is a business intelligence platform that specializes in providing powerful analytics tools for complex data. It is designed to handle large volumes of data, providing deep insights and powerful visualizations. Sisense is particularly popular for its ability to simplify complex data processing, making it easy to integrate, analyze, and visualize data from a variety of sources.
Sisense’s unique approach involves its in-chip technology, which accelerates data processing by performing analytics directly in memory. This allows for faster results and more efficient analysis. The platform also offers robust data modeling and reporting features, making it an ideal choice for businesses that need to generate sophisticated reports quickly. While Sisense is a powerful tool, it can be costly, and its complexity might be overwhelming for teams with little technical experience.
These are just a few examples of the top data analysis software currently available, and each offers its own strengths depending on the specific needs of your business. Whether you’re a small business just starting to explore data analysis or a large enterprise with complex needs, selecting the right software will depend on factors like your team’s expertise, the type of analysis required, and your budget. Each of these tools can unlock valuable insights, but it’s important to evaluate them carefully to find the best match for your company’s goals.
Data Analysis Software Features to Look For
When you’re on the hunt for the best data analysis software, the features of the tool are what ultimately determine whether it’s the right fit for your business. It’s not just about having the latest tech, but also about how those features align with your specific needs. The following are essential features you should look for to ensure you’re using the best software to maximize your data analysis efforts.
Data Processing and Cleaning Tools
Before diving into data analysis, you need to ensure that the data you’re working with is clean and well-organized. Raw data is often messy and inconsistent, which can lead to misleading results if not properly processed. A good data analysis tool should include robust data processing and cleaning features. This can include:
- Removing duplicates: Duplicate entries can inflate your data and affect the accuracy of your analysis.
- Handling missing data: Some tools offer automated methods for handling missing values, either by filling them in with averages or deleting incomplete records.
- Filtering and normalization: These features ensure your data is consistent and formatted in a way that makes analysis easier.
By having these tools, you can automate tedious tasks like cleaning, allowing you to focus on higher-value analysis. This also leads to more accurate insights because you’re working with better data from the start.
Visualization Capabilities
Data visualization is key to translating complex data into actionable insights. Without it, raw data can be difficult to understand, especially for non-technical stakeholders. Effective visualization tools should allow you to represent data in a way that’s visually engaging and easy to interpret. Some of the core visualization features to look for include:
- Variety of chart types: A good tool should offer a wide range of charts and graphs—bar charts, line graphs, heatmaps, scatter plots, and even geographic maps, depending on the type of data you’re working with.
- Interactive dashboards: Look for software that allows you to create interactive dashboards. These dashboards make it easier for decision-makers to interact with the data and explore it in real time.
- Customizable reports: Depending on your industry, you may need custom reports. Being able to create these from scratch or tailor pre-built templates is a big advantage.
Visualization capabilities help you uncover trends, patterns, and outliers that you might miss when looking at data in a raw format. They make the analysis process more intuitive and can communicate insights faster and more effectively to stakeholders.
Automation and AI-Powered Insights
Time is money, and one of the best ways to speed up data analysis is through automation. Good data analysis software often comes with built-in automation features that help with everything from cleaning data to generating reports. But the real game-changer is AI-powered insights.
Artificial Intelligence and machine learning can be used to:
- Identify trends and patterns: Instead of manually sifting through large datasets, AI can recognize correlations and trends in the data faster and more accurately.
- Predict future outcomes: Predictive analytics tools use historical data to forecast future trends. For example, a retailer could use AI to predict which products will be in demand based on past sales data.
- Automate data entry: AI can also automate the process of importing and entering data from various sources, reducing the time spent on manual tasks.
By leveraging automation and AI, you can quickly get to insights without needing to spend hours sorting through data manually. The added benefit is that AI tools can make predictions that you might not have thought of, helping you discover new opportunities or risks.
Integration with Other Tools and Platforms
Data analysis doesn’t happen in isolation. Your analysis software should seamlessly integrate with other tools and platforms your business relies on. Whether you’re working with a Customer Relationship Management (CRM) system, Enterprise Resource Planning (ERP) tools, or even cloud storage platforms like Google Drive or Dropbox, integrations are essential.
For example, if you’re analyzing sales data, you should be able to pull in data from your CRM or e-commerce platform directly into your analysis tool. Without easy integration, you’ll end up wasting time manually exporting and importing data across systems, which can introduce errors and slow down the analysis process.
Good integration also extends to data visualization tools. If your team is using a specific dashboard tool, make sure your analysis software can work with it, allowing you to share and visualize data more easily.
Scalability and Flexibility
As your business grows, so do your data needs. A tool that works well today may not be able to handle your increased volume of data or more complex analysis down the road. Scalability is the ability of a software tool to grow with your business, managing larger datasets and increasing user activity without performance issues.
You should also look for flexibility in the tool’s features. Scalability isn’t just about the ability to process larger volumes of data; it’s about being able to customize the analysis as your needs change. Whether it’s adding more users, adjusting to new business goals, or incorporating more complex analysis techniques, your data analysis tool should adapt with you.
Some tools are built for businesses of a certain size, while others offer more flexibility and can be scaled up as needed. Be sure to assess whether the software can handle your future requirements.
User-Friendliness and Customization Options
Even the best data analysis tools are only effective if your team can use them. A complex, hard-to-navigate tool is going to slow down productivity, no matter how powerful it is. User-friendliness is about how easy the software is to learn and use, especially for team members who might not have extensive technical skills.
In addition to ease of use, customization is also key. Customization options allow you to tailor the software to your specific business needs. Whether that means customizing data reports, visualizations, or the software’s interface, being able to adjust the software to suit your requirements is a huge advantage.
Look for tools that offer drag-and-drop features, intuitive interfaces, and personalized dashboards that make it easier for everyone in your organization to access and analyze the data they need without unnecessary complications. The easier the tool is to use, the faster your team will be able to adopt it and start making the most of its capabilities.
How to Choose the Best Data Analysis Software for Your Business?
Selecting the right data analysis software is one of the most important decisions you’ll make for your business. The wrong tool can lead to wasted time, inaccurate results, and missed opportunities. On the other hand, the right software can save time, improve decision-making, and ultimately help your business thrive. To make an informed choice, it’s essential to evaluate several factors that will determine the best fit for your organization.
1. Understand Your Team’s Needs and Skills
Every business has a unique team with varying skill levels, which should heavily influence your decision when choosing data analysis software. The first thing to consider is the expertise of your team. Are they experienced data scientists who are comfortable with complex tools, or are they business analysts who need a simpler, more intuitive platform?
If your team is made up of advanced data professionals, they’ll likely need a tool with sophisticated features such as predictive analytics, machine learning capabilities, and advanced statistical models. In this case, you might lean toward tools like SAS or R that provide powerful features but come with a steeper learning curve.
On the other hand, if your team lacks in-depth technical expertise, you’ll want to opt for software that prioritizes ease of use and provides strong data visualization features. Tools like Tableau or Microsoft Power BI are great for teams that want to quickly create insightful dashboards without needing to write any code.
By understanding your team’s current capabilities, you can avoid overcomplicating things with tools that are too advanced or, conversely, selecting software that is too basic for your needs. Ensuring your team can effectively use the tool is essential for getting the most value from your data.
2. Consider Industry-Specific Requirements
Different industries have different needs when it comes to data analysis. What works well for a retail business might not be as effective for a healthcare provider or a financial institution. Before selecting a tool, it’s important to consider any industry-specific requirements that might influence your decision.
For example, in the healthcare industry, data privacy and compliance with regulations like HIPAA (Health Insurance Portability and Accountability Act) are critical. You’ll need software that provides strong data security features and is compliant with these regulations. Tools like SAS or IBM Watson Analytics are often used in the healthcare sector due to their emphasis on security and compliance.
For financial institutions, predictive analytics and advanced modeling capabilities are often a priority, as these tools can help forecast market trends, assess risks, and optimize investment strategies. A more specialized tool may be necessary to cater to the specific analytical models used in finance.
E-commerce businesses may need software that integrates seamlessly with platforms like Shopify, Magento, or WooCommerce to track customer behavior and sales trends in real-time. For such businesses, look for tools that offer strong integration features and e-commerce analytics tools.
Assessing the unique needs of your industry will help narrow down your choices. Tools that are built specifically for your sector will be better equipped to handle the data types and challenges you face on a daily basis.
3. Evaluate Long-Term Scalability and Support
As your business grows, so will your data analysis needs. You don’t want to invest in a tool that meets your needs today but can’t scale with your business as it expands. Scalability refers to the software’s ability to handle increased data volumes, support more users, and adapt to new features or requirements over time.
Consider the following factors when evaluating scalability:
- Data Growth: How much data are you working with now, and how much do you anticipate handling in the next few years? Make sure the software can scale to accommodate larger datasets without a drop in performance.
- Number of Users: As your business expands, so will the number of people who need access to the software. Look for tools that allow for easy user management and can support a growing team.
- Advanced Features: Your business needs may evolve, and you may require more advanced analytical features down the line. Choose software that offers upgrades, additional functionalities, or the ability to add custom features as you need them.
Support is also a crucial consideration. A software tool with robust customer service, tutorials, and a dedicated support team can save you time and frustration when issues arise. Check if the software provider offers 24/7 support, community forums, or a dedicated account manager. Knowing you have access to assistance when needed provides peace of mind as you scale your operations.
4. Test and Leverage Trial Options
Before committing to any data analysis software, take advantage of testing and trial options. Most reputable software providers offer free trials or demo versions of their products so you can explore the features and interface before making a purchase.
During the trial period, it’s important to thoroughly test how well the tool meets your team’s needs. Make sure to evaluate:
- Ease of Use: How intuitive is the software? Does your team feel comfortable navigating it and accessing the features they need?
- Integration: How well does the software integrate with other tools or platforms your team is currently using? Test importing and exporting data, as well as setting up dashboards or reports.
- Performance: Does the tool handle your current data needs effectively? Test its ability to process large datasets, generate reports, and perform analyses quickly.
- Customization: Is the software flexible enough to customize the features to fit your specific business requirements? Check if you can adjust the settings, reporting formats, and visualization styles.
By using trial versions, you give your team the opportunity to experience the tool firsthand, ensuring that it’s the right fit for your business. Also, don’t forget to involve key decision-makers and users during the testing phase. Their feedback will be invaluable when making the final choice.
Testing the software before purchase also allows you to assess any potential limitations or technical issues that could affect your workflow. If the tool doesn’t perform as expected or lacks critical features, you’ll have the chance to find a better alternative before committing financially.
Choosing the right data analysis software is not just about picking the most advanced tool on the market; it’s about understanding your team’s needs, industry requirements, long-term goals, and evaluating software options through trials to ensure it fits your business perfectly. By considering these factors, you’ll be in a strong position to make a decision that helps your business thrive in a data-driven world.
Data Analysis Software Challenges and Pitfalls to Avoid
Data analysis software can be incredibly powerful, but without careful consideration, it’s easy to make mistakes that undermine its effectiveness. Here are some common pitfalls to watch out for when using data analysis software:
- Overcomplicating the Analysis: It’s tempting to dig deep into every dataset and run complex analyses, but this can quickly lead to analysis paralysis. Keep it simple—focus on what truly matters for your business decisions and avoid over-analyzing. Sometimes, less is more, especially when trying to communicate results to non-technical stakeholders.
- Ignoring Data Quality: Even the most advanced data analysis tools won’t help you if your data is incomplete, incorrect, or poorly structured. Make sure you clean and preprocess your data properly before jumping into analysis. Bad data leads to bad insights.
- Lack of Clear Objectives: Without clear goals, you risk running unnecessary or irrelevant analyses. Before diving into the data, define what you want to achieve. This will help you choose the right metrics and analyses to focus on.
- Not Involving Stakeholders Early: Many businesses make the mistake of running analysis and then trying to present findings to stakeholders who don’t understand the results. Make sure key stakeholders are involved in the process early on to ensure the analysis aligns with their needs and priorities.
- Overlooking Data Security and Privacy: When working with sensitive information, especially in industries like healthcare or finance, overlooking data security can lead to serious legal consequences. Make sure the software you choose complies with data protection laws like GDPR or HIPAA, and always prioritize data security.
- Failing to Keep Skills Updated: Data analysis tools and techniques are evolving rapidly. Without continuous training, your team might not be able to leverage all the features or stay on top of best practices. Regularly invest in training and upskilling to keep your team sharp.
- Underestimating the Time Investment: Data analysis can take longer than expected, especially when you’re working with large datasets or complex models. Underestimating the time it takes to prepare data, analyze it, and interpret the results can cause delays and lead to rushed conclusions. Be realistic about timelines.
- Not Regularly Updating the Software: Software updates often include important features, bug fixes, and security patches. Failing to regularly update your data analysis tools can lead to inefficiencies and even data vulnerabilities.
- Relying Too Much on the Tool’s Recommendations: While AI-powered insights and automated recommendations can be helpful, don’t fall into the trap of accepting them blindly. Always cross-check and validate the results before making decisions. Human intuition and business knowledge are crucial in interpreting the final insights.
- Overlooking User Feedback: If your team is struggling with using the software or isn’t getting the insights they need, don’t ignore the feedback. Actively solicit input from users to ensure the software is serving their needs and adjust accordingly.
By avoiding these pitfalls, you can maximize the effectiveness of your data analysis software and ensure that it adds real value to your business.
Conclusion
Choosing the right data analysis software for your business is a decision that can significantly impact how efficiently you process data and make decisions. With so many great options out there, it’s important to consider the specific needs of your team, the scale of your data, and the level of analysis required. Whether you prioritize ease of use, powerful predictive analytics, or robust data visualization tools, there’s software out there that’s built to support your goals. The best tool is the one that allows you to access meaningful insights quickly, collaborate with your team, and scale as your data needs grow.
Ultimately, the right data analysis software should make your job easier and give you a clearer view of your data. Take the time to explore the features, benefits, and pricing of each tool to ensure it fits within your company’s budget and technical capabilities. Testing the software through free trials or demos will help you make an informed decision and ensure the tool you choose can meet your specific challenges. Whether you’re just starting out with data analysis or looking for more advanced capabilities, the perfect tool is out there—ready to help you make smarter, data-driven decisions every day.
Get Started With a Prebuilt Template!
Looking to streamline your business financial modeling process with a prebuilt customizable template? Say goodbye to the hassle of building a financial model from scratch and get started right away with one of our premium templates.
- Save time with no need to create a financial model from scratch.
- Reduce errors with prebuilt formulas and calculations.
- Customize to your needs by adding/deleting sections and adjusting formulas.
- Automatically calculate key metrics for valuable insights.
- Make informed decisions about your strategy and goals with a clear picture of your business performance and financial health.
-
Sale!

Marketplace Financial Model Template
Original price was: $219.00.$149.00Current price is: $149.00. Add to Cart -
Sale!
E-Commerce Financial Model Template
Original price was: $219.00.$149.00Current price is: $149.00. Add to Cart -
Sale!

SaaS Financial Model Template
Original price was: $219.00.$149.00Current price is: $149.00. Add to Cart -
Sale!
Standard Financial Model Template
Original price was: $219.00.$149.00Current price is: $149.00. Add to Cart -
Sale!
E-Commerce Profit and Loss Statement
Original price was: $119.00.$79.00Current price is: $79.00. Add to Cart -
Sale!
SaaS Profit and Loss Statement
Original price was: $119.00.$79.00Current price is: $79.00. Add to Cart -
Sale!
Marketplace Profit and Loss Statement
Original price was: $119.00.$79.00Current price is: $79.00. Add to Cart -
Sale!
Startup Profit and Loss Statement
Original price was: $119.00.$79.00Current price is: $79.00. Add to Cart -
Sale!
Startup Financial Model Template
Original price was: $119.00.$79.00Current price is: $79.00. Add to Cart


