
Are you looking for a way to make sense of all the data your business is handling? Dashboard software could be the solution you need. These tools help you bring all your important metrics into one place, allowing you to track performance, make better decisions, and respond faster to changes. Whether you’re keeping an eye on sales numbers, customer engagement, or operational efficiency, the right dashboard software can save you time and provide clarity.
In this guide, we’ll explore the best dashboard software options available today, breaking down their features, benefits, and what makes each one unique so you can choose the right one for your business needs.
What is Dashboard Software?
Dashboard software is a powerful tool that allows businesses and individuals to visualize and track key performance indicators (KPIs) and other important metrics in real time. These software platforms consolidate data from various sources into a single, interactive interface, enabling users to gain insights at a glance and make informed decisions based on up-to-date information.
Dashboards are designed to simplify complex data by presenting it in easy-to-understand visual formats, such as charts, graphs, and tables. They provide a centralized view of your business or project’s performance, making it easier to monitor progress, identify trends, and spot potential issues before they become significant problems.
Dashboard software can be customized to suit the specific needs of different industries and functions. Whether you’re tracking sales performance, customer service metrics, or financial data, dashboard software can adapt to meet your requirements and help you stay on top of your most critical objectives.
The Importance of Dashboard Software
Dashboard software plays a vital role in today’s fast-paced, data-driven world. It allows businesses to make informed decisions quickly by providing an accessible, real-time overview of important metrics and performance indicators. Here’s why dashboard software is crucial:
- Centralizes all critical data in one place, allowing users to see an overview of their operations without having to check multiple platforms or sources.
- Simplifies decision-making by providing clear, visual insights, enabling quick understanding and action.
- Encourages data-driven culture within organizations by making data accessible and easy to interpret for all team members.
- Helps identify trends and patterns that can inform strategies for growth, efficiency, and cost savings.
- Improves communication and collaboration by allowing teams to access and discuss data in real time, fostering a more transparent working environment.
The Role of Dashboards in Data Visualization and Decision-Making
Dashboards play a crucial role in data visualization by transforming raw data into visual formats that are easy to interpret. Rather than sifting through spreadsheets or complex reports, dashboard users can view their data in visually engaging ways, making it easier to identify trends, anomalies, and areas for improvement.
Effective dashboards help streamline decision-making by offering key insights at a glance. Decision-makers can monitor the health of their operations in real time and quickly assess whether their current strategies are working or need adjustment. Dashboards also facilitate collaboration, as they allow teams to share data and insights quickly, ensuring that everyone is on the same page.
By integrating real-time data from various systems, dashboards allow businesses to respond more quickly to changes in the market, customer behavior, or internal performance. For example, a marketing team can adjust their campaigns on the fly based on the performance data shown on their dashboard, ensuring their efforts are always optimized for the best results.
Benefits of Using Dashboard Software for Businesses and Individuals
Dashboard software provides a wide range of benefits for both businesses and individuals by improving data accessibility, decision-making, and performance tracking. Here are the key advantages of using dashboard software:
- Real-time monitoring of key metrics and performance indicators helps businesses stay on top of changes and respond quickly to new developments.
- Improved decision-making by providing clear, actionable insights from consolidated data, which reduces reliance on guesswork or intuition.
- Time-saving by eliminating the need to manually gather and analyze data from various sources, allowing teams to focus on more strategic tasks.
- Better performance tracking by visualizing progress against goals, which helps identify areas of success and opportunities for improvement.
- Customization options that allow businesses to tailor dashboards to their specific needs, ensuring that only the most relevant data is being displayed.
- Increased collaboration by providing a shared platform for teams to discuss performance, track projects, and make data-driven decisions collectively.
- Enhanced accountability as teams and individuals can track their progress in real time, leading to better performance management and goal alignment.
- Scalability for growing businesses, as dashboard software can adapt to increased data complexity and team size without losing effectiveness.
- Cost-effectiveness by providing businesses with an easy way to analyze and optimize performance, potentially saving money by identifying inefficiencies or areas to cut costs.
Top Dashboard Software Solutions
Choosing the right dashboard software depends on a variety of factors, including your business size, the type of data you need to visualize, and the level of customization you require. Fortunately, there are a number of powerful dashboard tools available, each offering unique features tailored to different industries and business needs. Below are some of the top dashboard software solutions for 2025 that have earned recognition for their performance, versatility, and ease of use.
Power BI
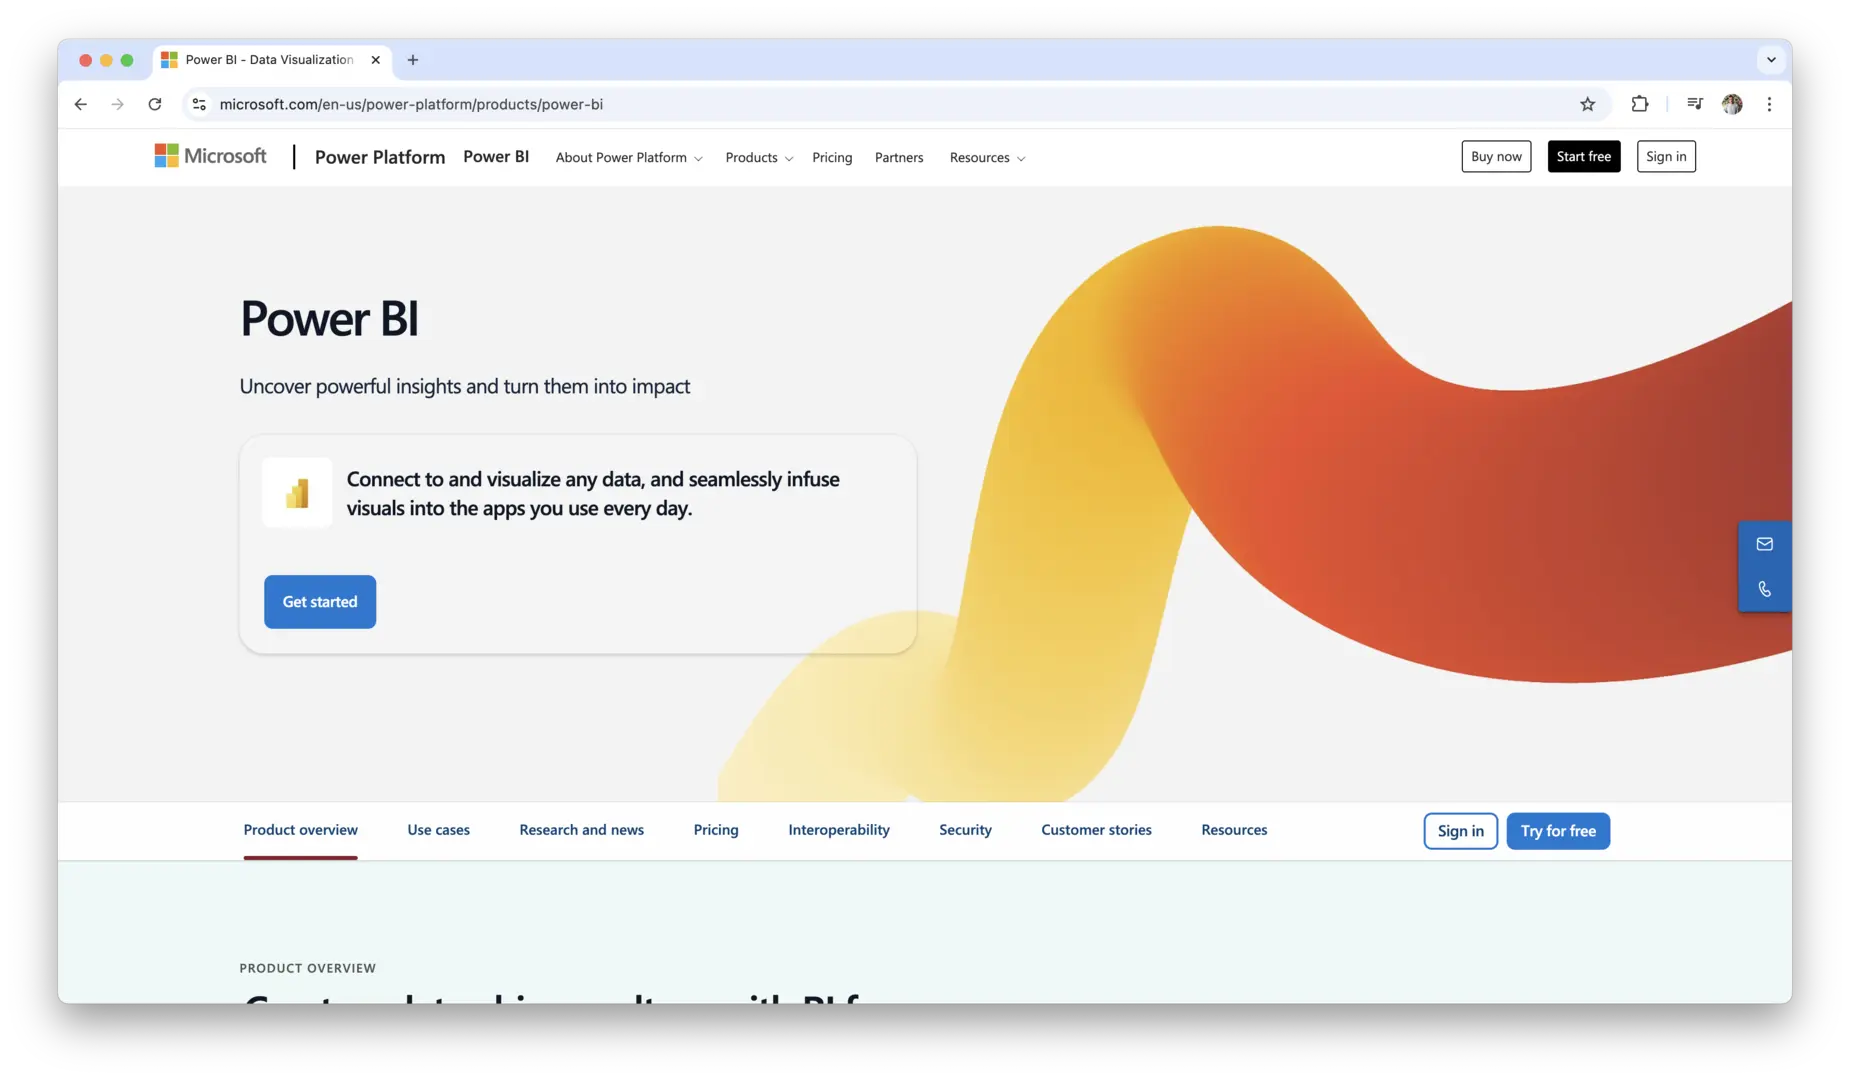
Power BI by Microsoft is a leader in the dashboard software space, particularly known for its powerful data analytics and visualization capabilities. As part of the Microsoft ecosystem, Power BI integrates seamlessly with tools like Excel, Azure, and SharePoint, making it an ideal choice for businesses already using these platforms. Power BI allows users to pull in data from multiple sources, clean and transform it, and create interactive, customizable dashboards with ease. It also includes AI-powered features, such as automated insights and forecasting, to help businesses make data-driven decisions more quickly.
One of Power BI’s standout features is its ability to handle large datasets with ease, making it suitable for businesses of all sizes, from small startups to large enterprises. The software also offers various pricing options, including a free version for individual users and affordable plans for teams and larger organizations.
Tableau
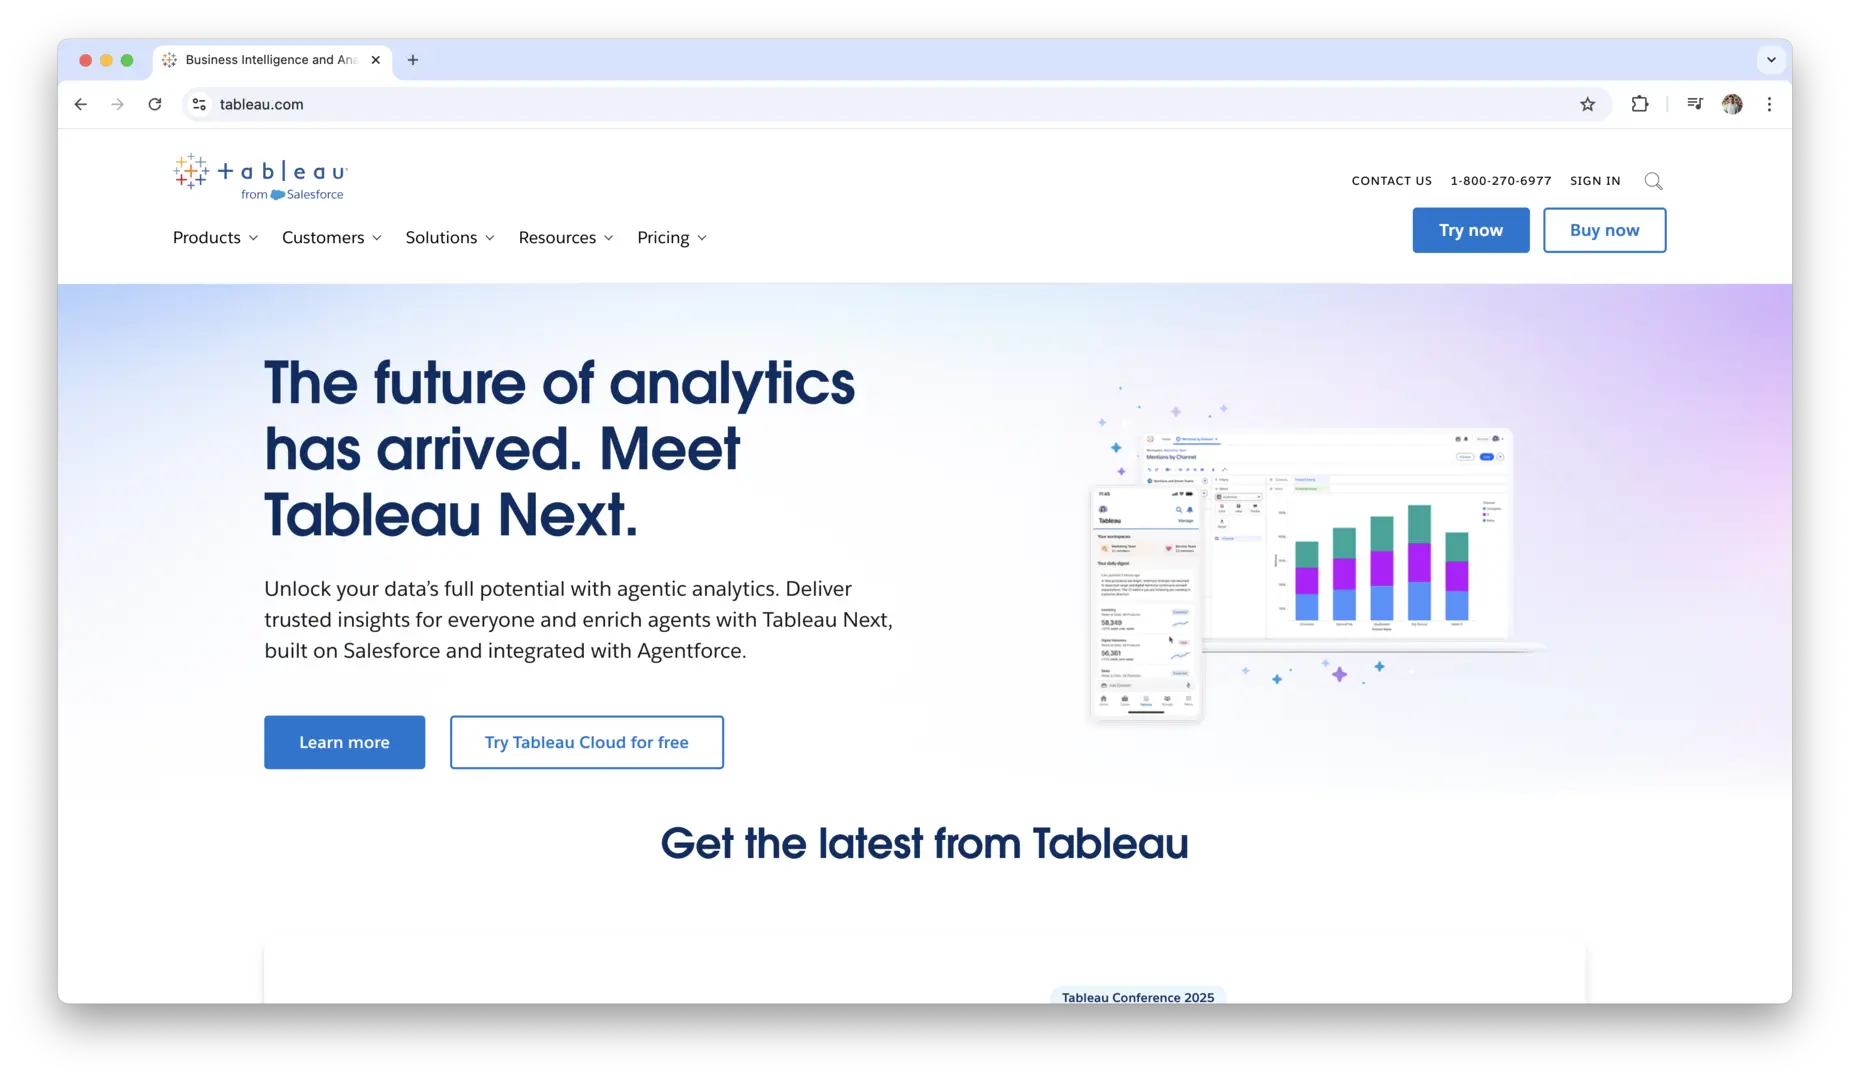
Tableau is another top contender in the dashboard software market, especially recognized for its exceptional data visualization capabilities. Tableau allows users to create interactive, shareable dashboards that help businesses visualize complex data in a clear and engaging way. Its drag-and-drop interface makes it easy for both beginners and advanced users to build custom dashboards without needing coding knowledge.
Tableau stands out due to its ability to connect to a wide variety of data sources, both cloud-based and on-premise. It also supports real-time data updates, which ensures that businesses can make decisions based on the most up-to-date information. The tool is widely used in industries such as finance, marketing, and healthcare, and is known for its advanced analytics capabilities, including predictive analysis and trend forecasting.
Tableau also offers a robust community and extensive support resources, making it easy to find solutions to any issues or learn best practices for creating effective dashboards. Its scalability is another key feature, with options for individual users, small teams, and large enterprises.
Looker Studio
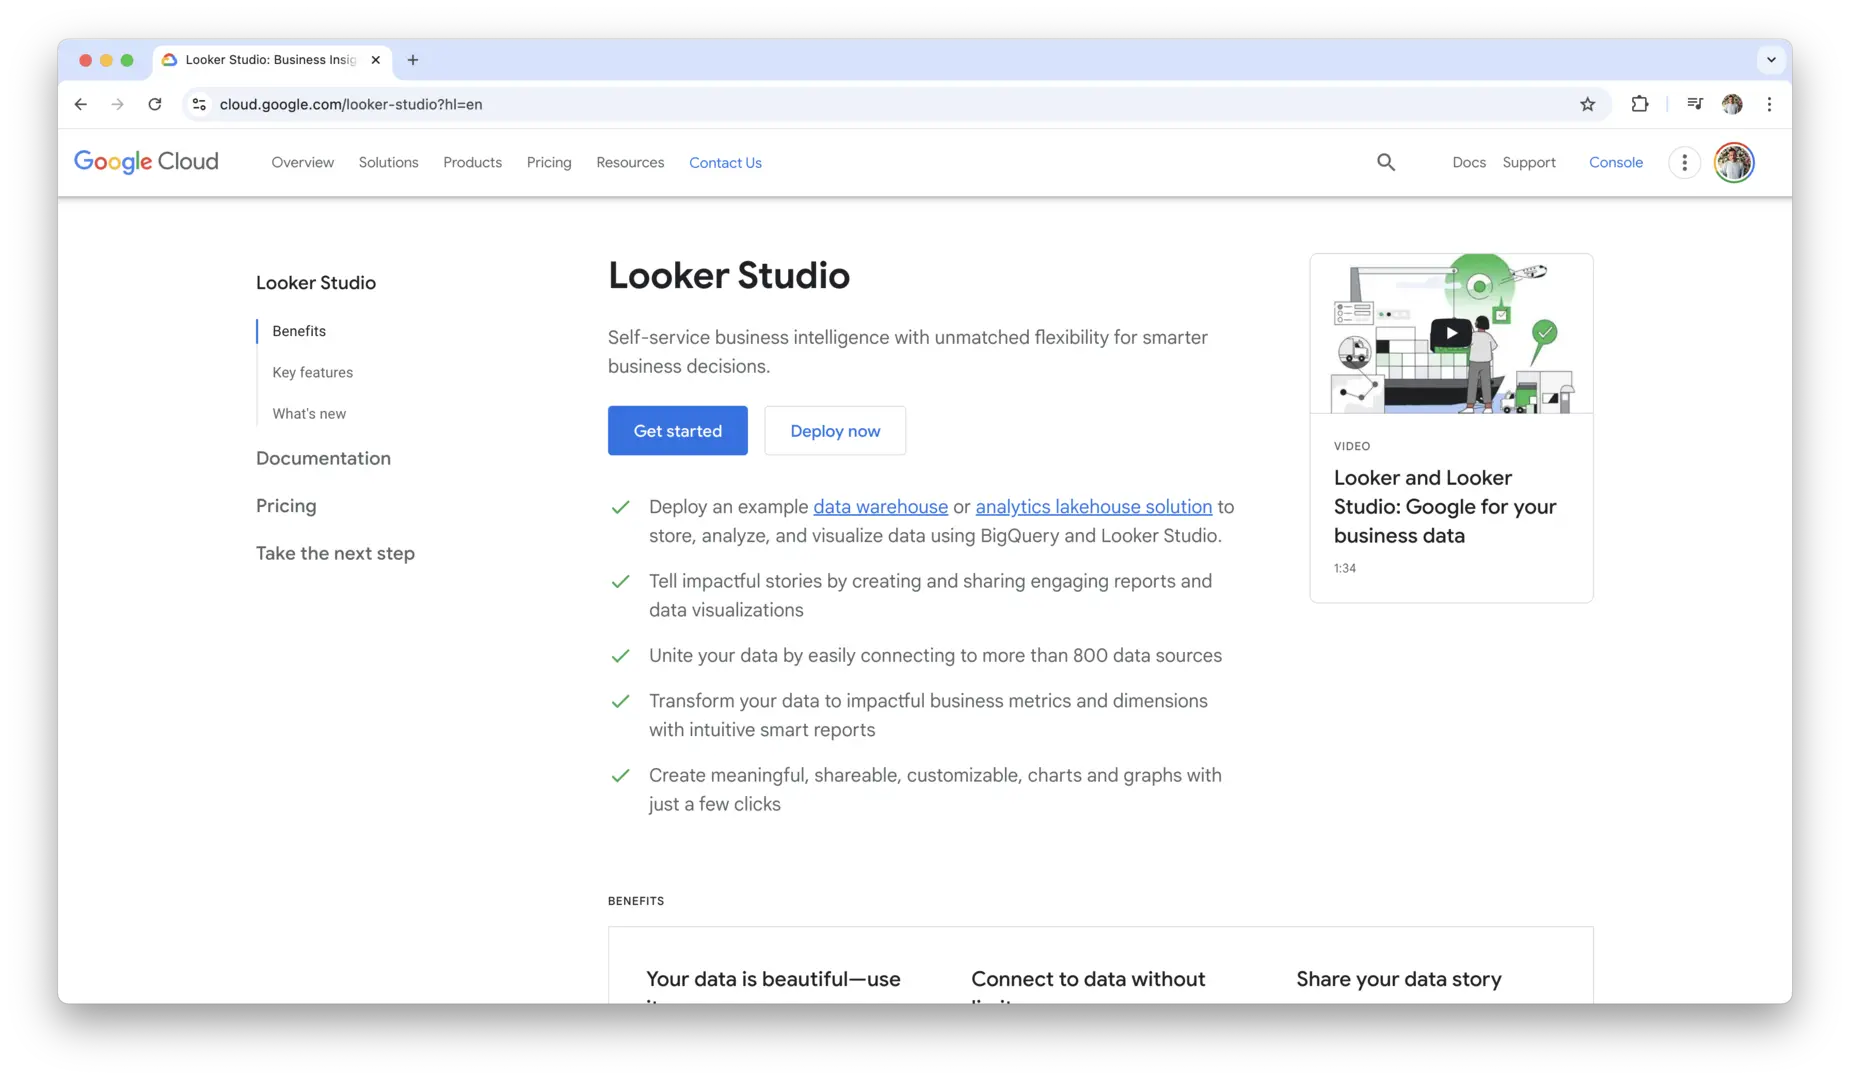
Google Looker Studio, previously Data Studio, is a free, cloud-based dashboard tool that is particularly popular among small businesses and teams that use Google products. It integrates seamlessly with a wide range of Google services, including Google Analytics, Google Ads, and BigQuery, making it a great option for businesses that already rely on the Google ecosystem. Looker Studio enables users to create custom dashboards that are easy to share and collaborate on.
The user interface is simple and intuitive, which makes it accessible even for non-technical users. Google Looker Studio also allows for easy customization, so users can design dashboards that fit their specific needs. While it may not have the depth of features found in other tools like Power BI or Tableau, its ease of use and free pricing structure make it a solid choice for small businesses or anyone on a budget.
In addition to its integration with Google tools, Google Looker Studio supports a variety of third-party connectors, enabling users to bring in data from platforms like social media, CRMs, and more. It’s an ideal solution for businesses looking for a straightforward, cost-effective way to visualize data.
Klipfolio
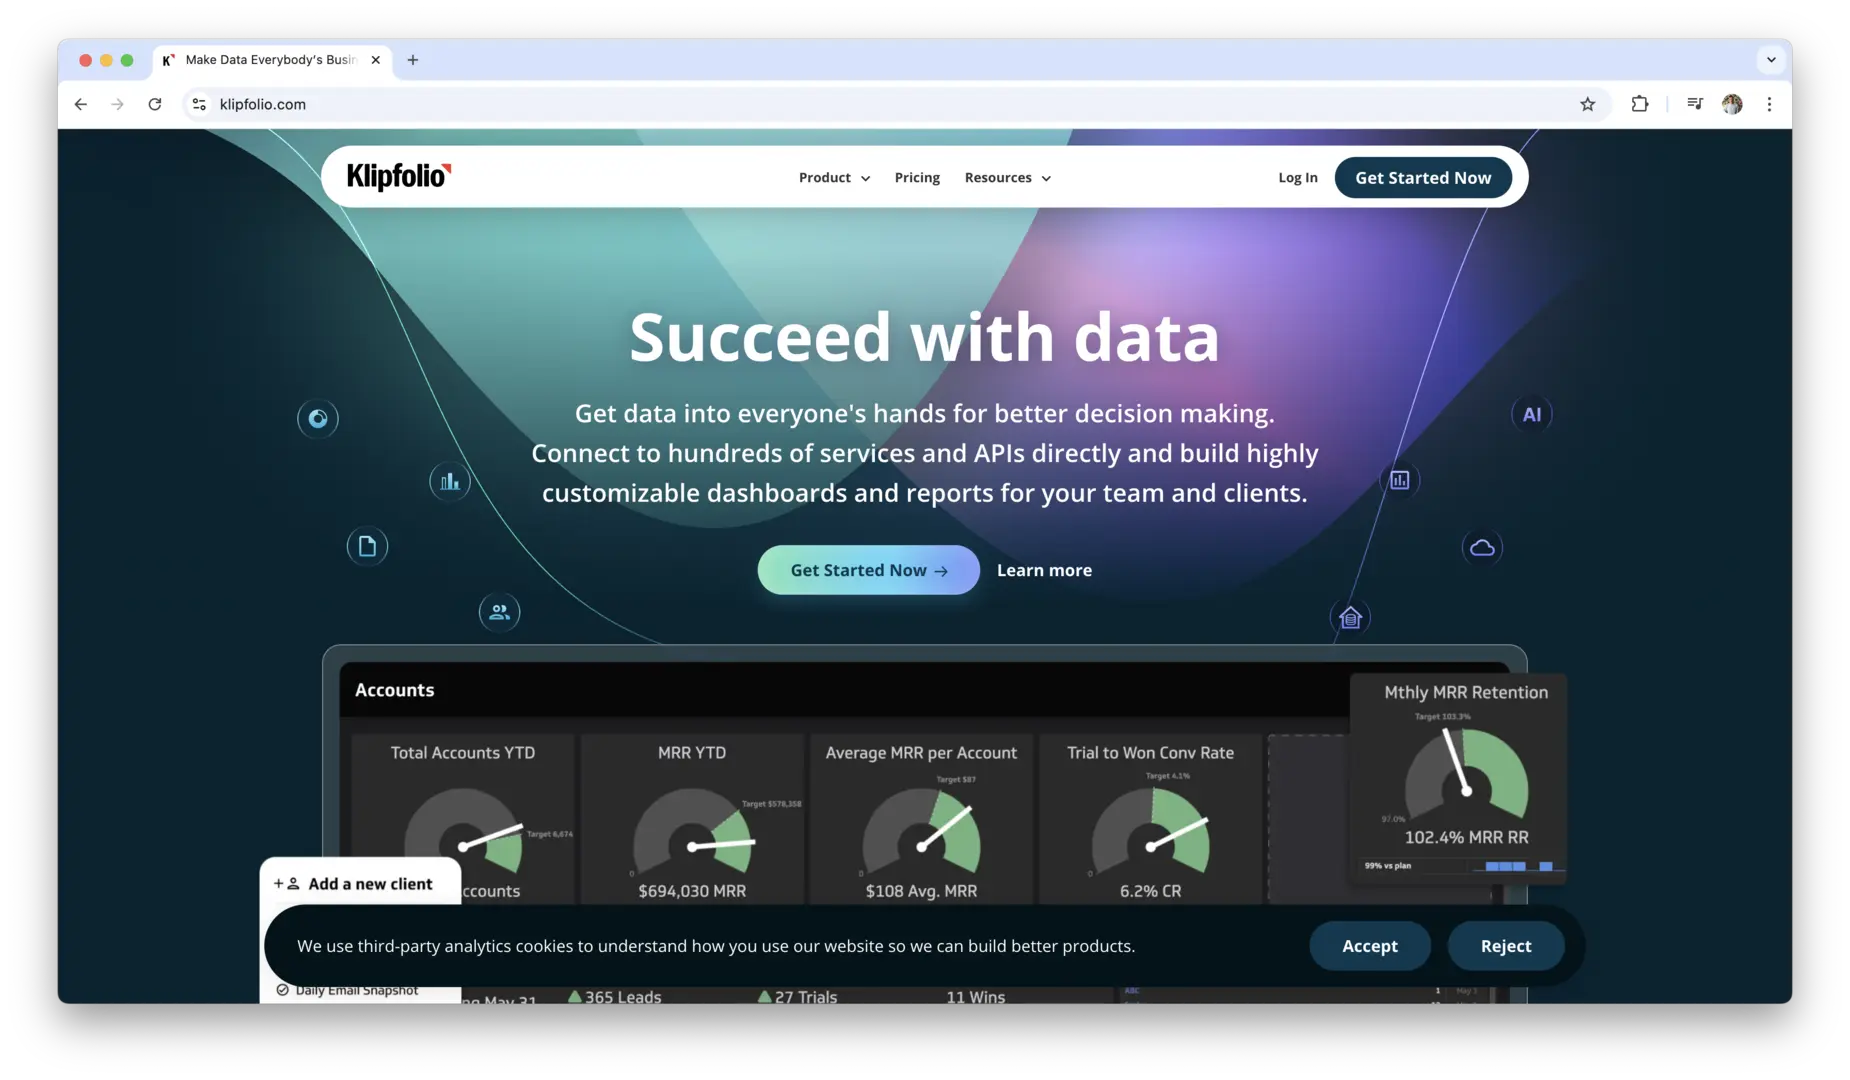
Klipfolio is a cloud-based dashboard software that offers real-time data integration and advanced reporting capabilities. Known for its simplicity and flexibility, Klipfolio allows users to create custom dashboards that integrate with a wide range of data sources, including Google Analytics, Salesforce, and databases like MySQL and SQL Server. Its drag-and-drop interface makes it easy for users to build and customize dashboards without needing coding experience.
Klipfolio stands out for its focus on real-time data, providing businesses with up-to-the-minute insights. It is particularly useful for teams that need to track performance metrics across multiple departments, as it supports multi-user access with customizable permissions. Klipfolio also offers extensive collaboration features, enabling teams to share and discuss data in real-time.
One of the unique aspects of Klipfolio is its ability to connect to custom data sources through API integrations, allowing businesses to bring in data from proprietary systems. This flexibility makes Klipfolio a great choice for businesses with specific or unique data integration needs.
Domo
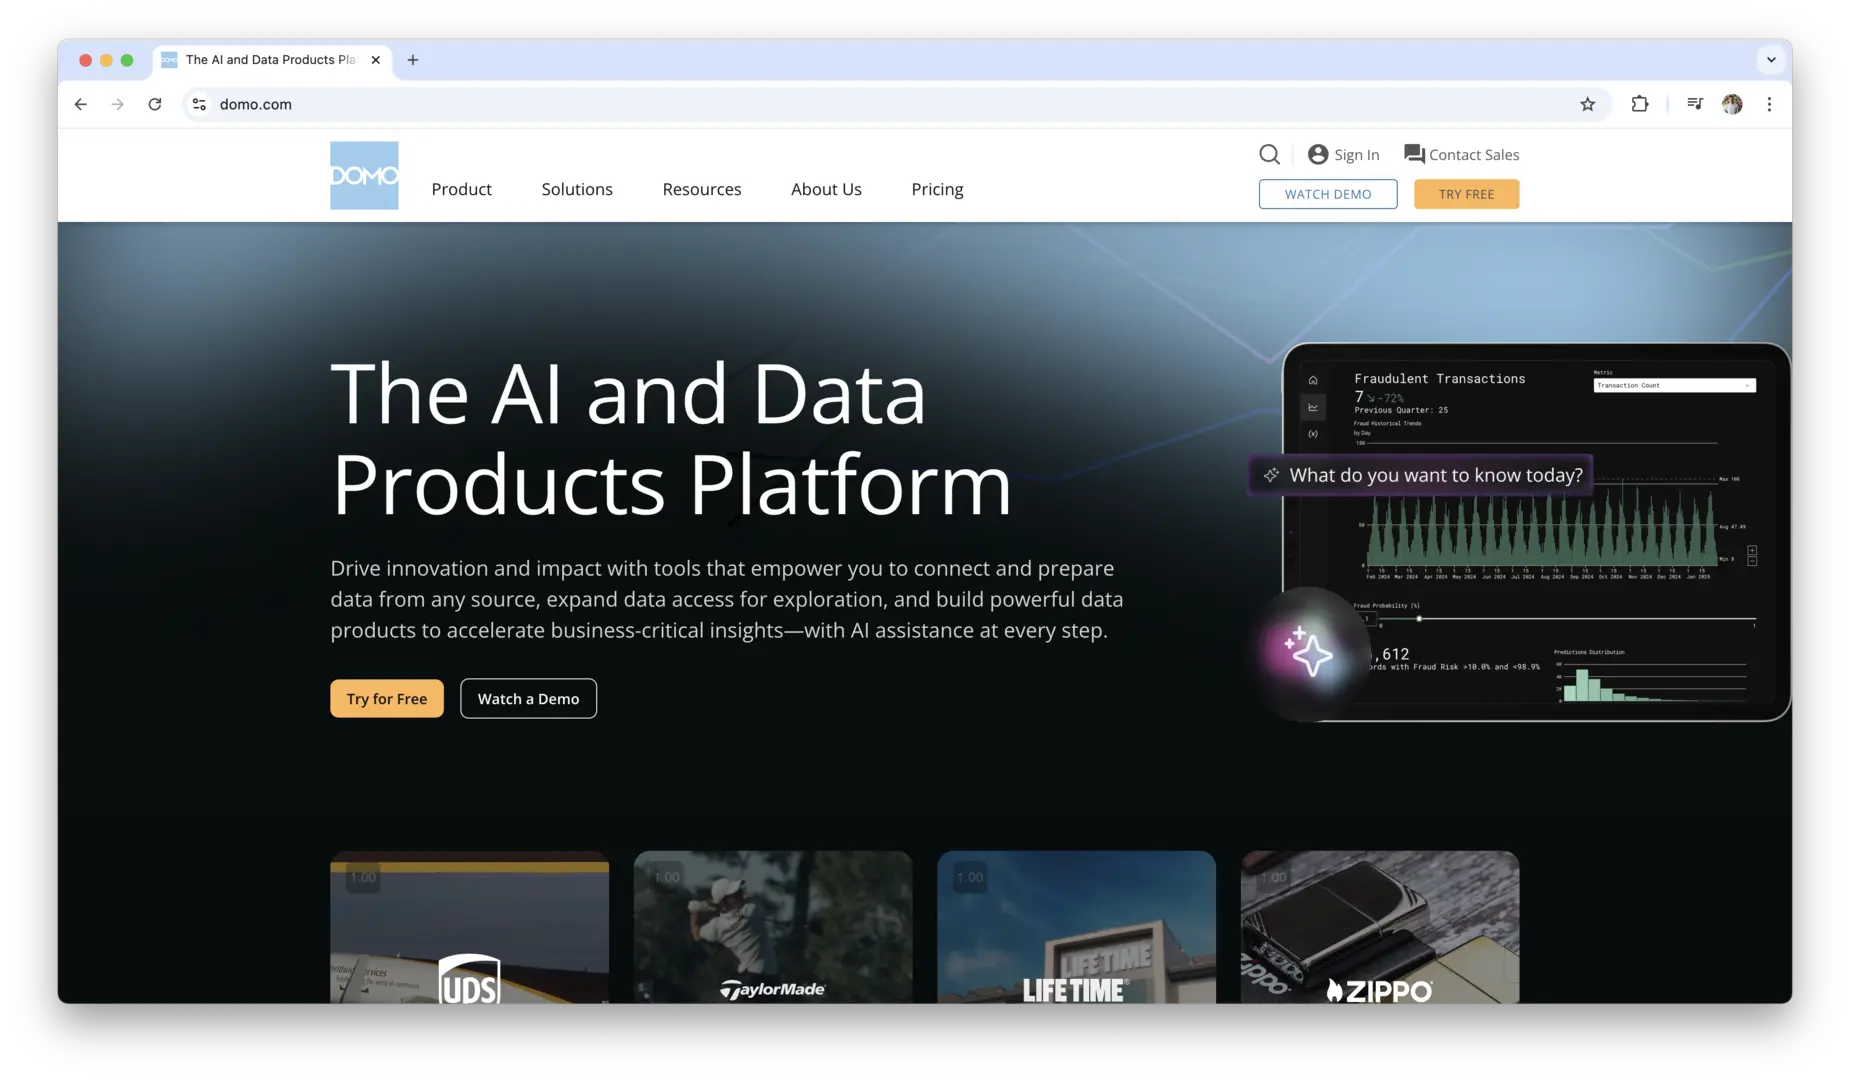
Domo is an all-in-one business intelligence platform that combines data integration, visualization, and analytics in one tool. It is designed to serve businesses of all sizes, offering a cloud-based solution that scales easily as a company grows. Domo’s dashboard software provides deep analytics capabilities, enabling users to create visually rich, interactive dashboards that track everything from sales and marketing to operations and HR metrics.
Domo’s standout feature is its data integration capabilities. It can pull data from over 1,000 sources, including cloud-based apps, databases, and even spreadsheets, making it an ideal choice for businesses with diverse data systems. The software also supports real-time data updates, which is essential for businesses that need to make decisions based on the latest information.
In addition to its visualization features, Domo provides powerful analytics tools, including AI-driven insights and predictive analytics, to help businesses identify trends and make informed decisions. The platform’s user-friendly interface ensures that both technical and non-technical users can navigate and create dashboards without difficulty. Domo is particularly favored by large enterprises due to its ability to manage large datasets and provide high-level insights across multiple teams and departments.
Sisense
Sisense is a comprehensive business intelligence platform that specializes in simplifying complex data and presenting it in clear, interactive dashboards. Sisense’s standout feature is its ability to handle large datasets and perform complex data analysis, which makes it ideal for businesses that deal with vast amounts of data from multiple sources. Sisense integrates seamlessly with databases, cloud platforms, and APIs, allowing businesses to centralize their data and make better decisions. The platform’s drag-and-drop interface makes it easy for non-technical users to create dashboards, while advanced users can take advantage of its powerful analytics features.
Sisense is particularly known for its scalability, making it a great choice for businesses that are rapidly growing or have diverse data systems. With its user-friendly design and customizable dashboards, Sisense is an excellent choice for companies looking to turn complex data into actionable insights.
Geckoboard
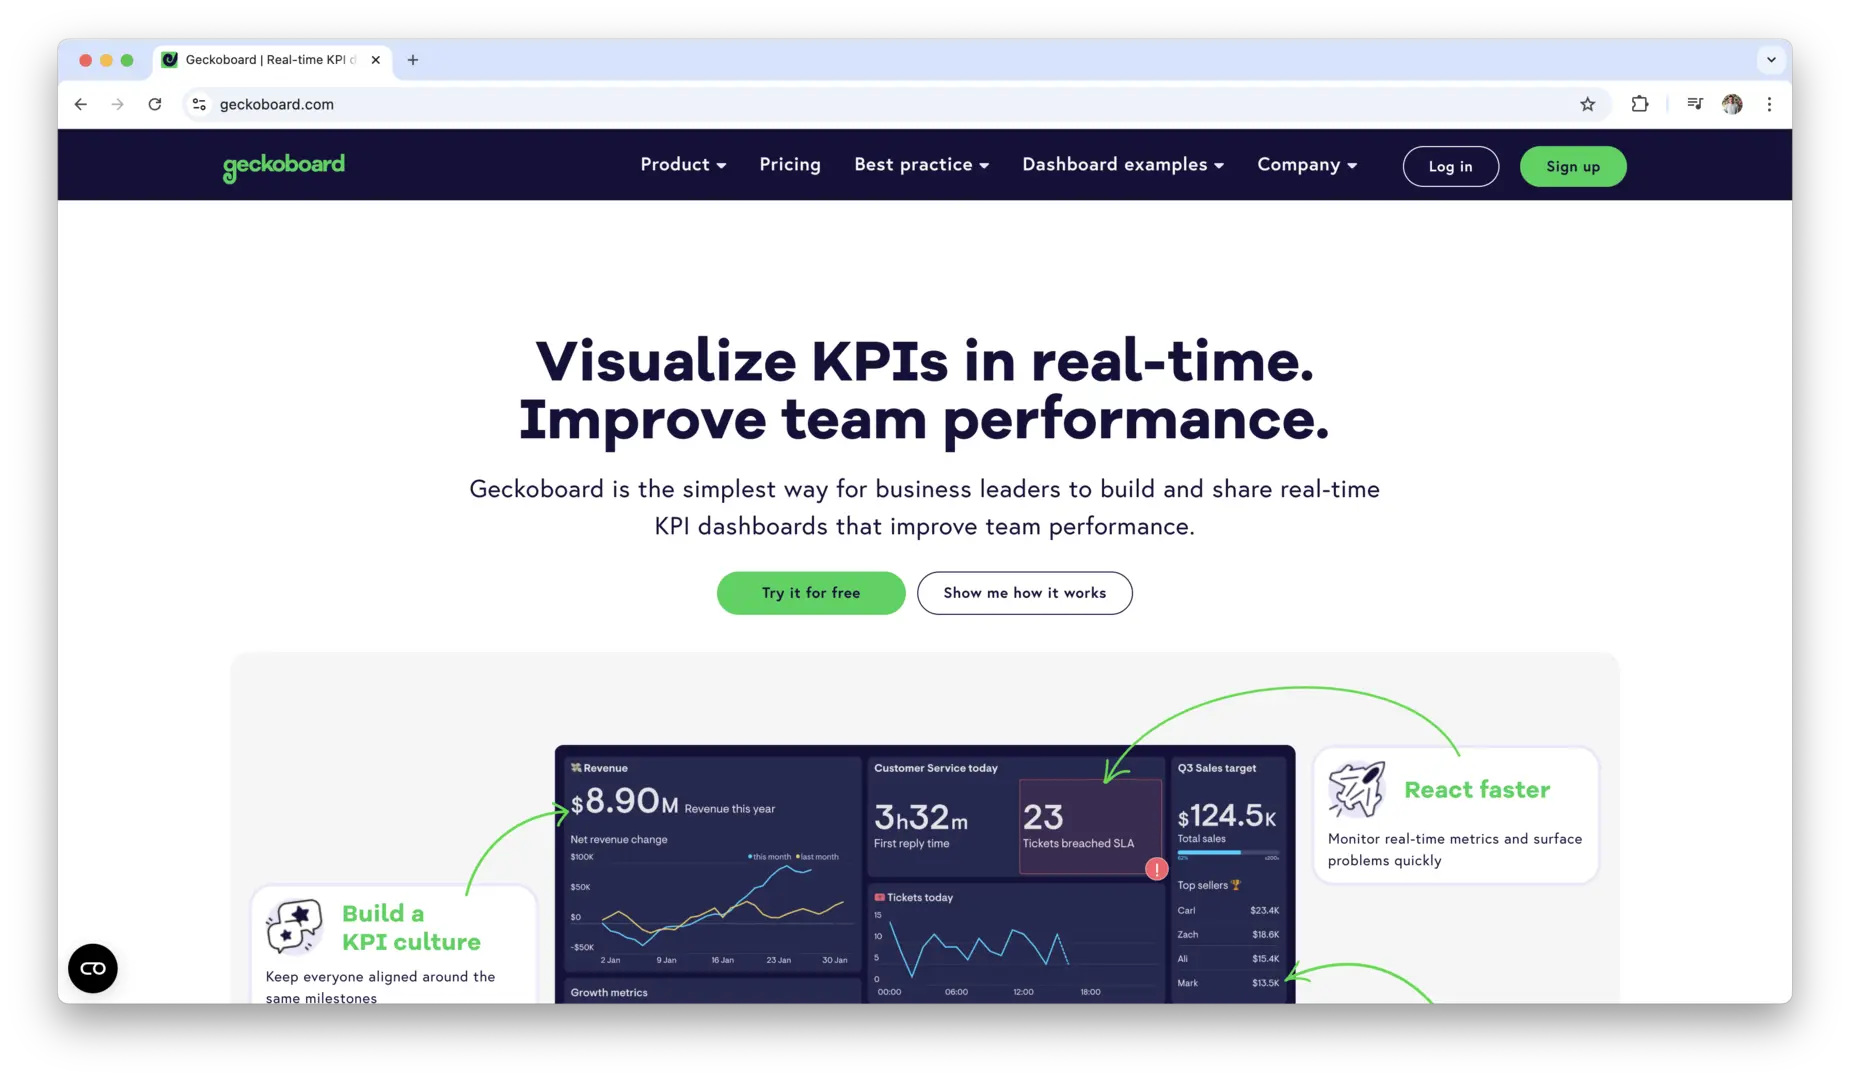
Geckoboard is a user-friendly dashboard tool designed to help businesses visualize and monitor key metrics in real time. It’s particularly suited for teams that need to display real-time data from various sources, including marketing, sales, and customer support. Geckoboard connects with popular platforms such as Google Analytics, Salesforce, and HubSpot, allowing businesses to pull in data from multiple sources and create customized dashboards that reflect their specific needs.
One of the defining features of Geckoboard is its simplicity. The tool is designed for ease of use, so even non-technical users can quickly set up and monitor their data. Geckoboard is ideal for small to medium-sized businesses that want a straightforward, effective way to track performance metrics without a steep learning curve.
Zoho Analytics
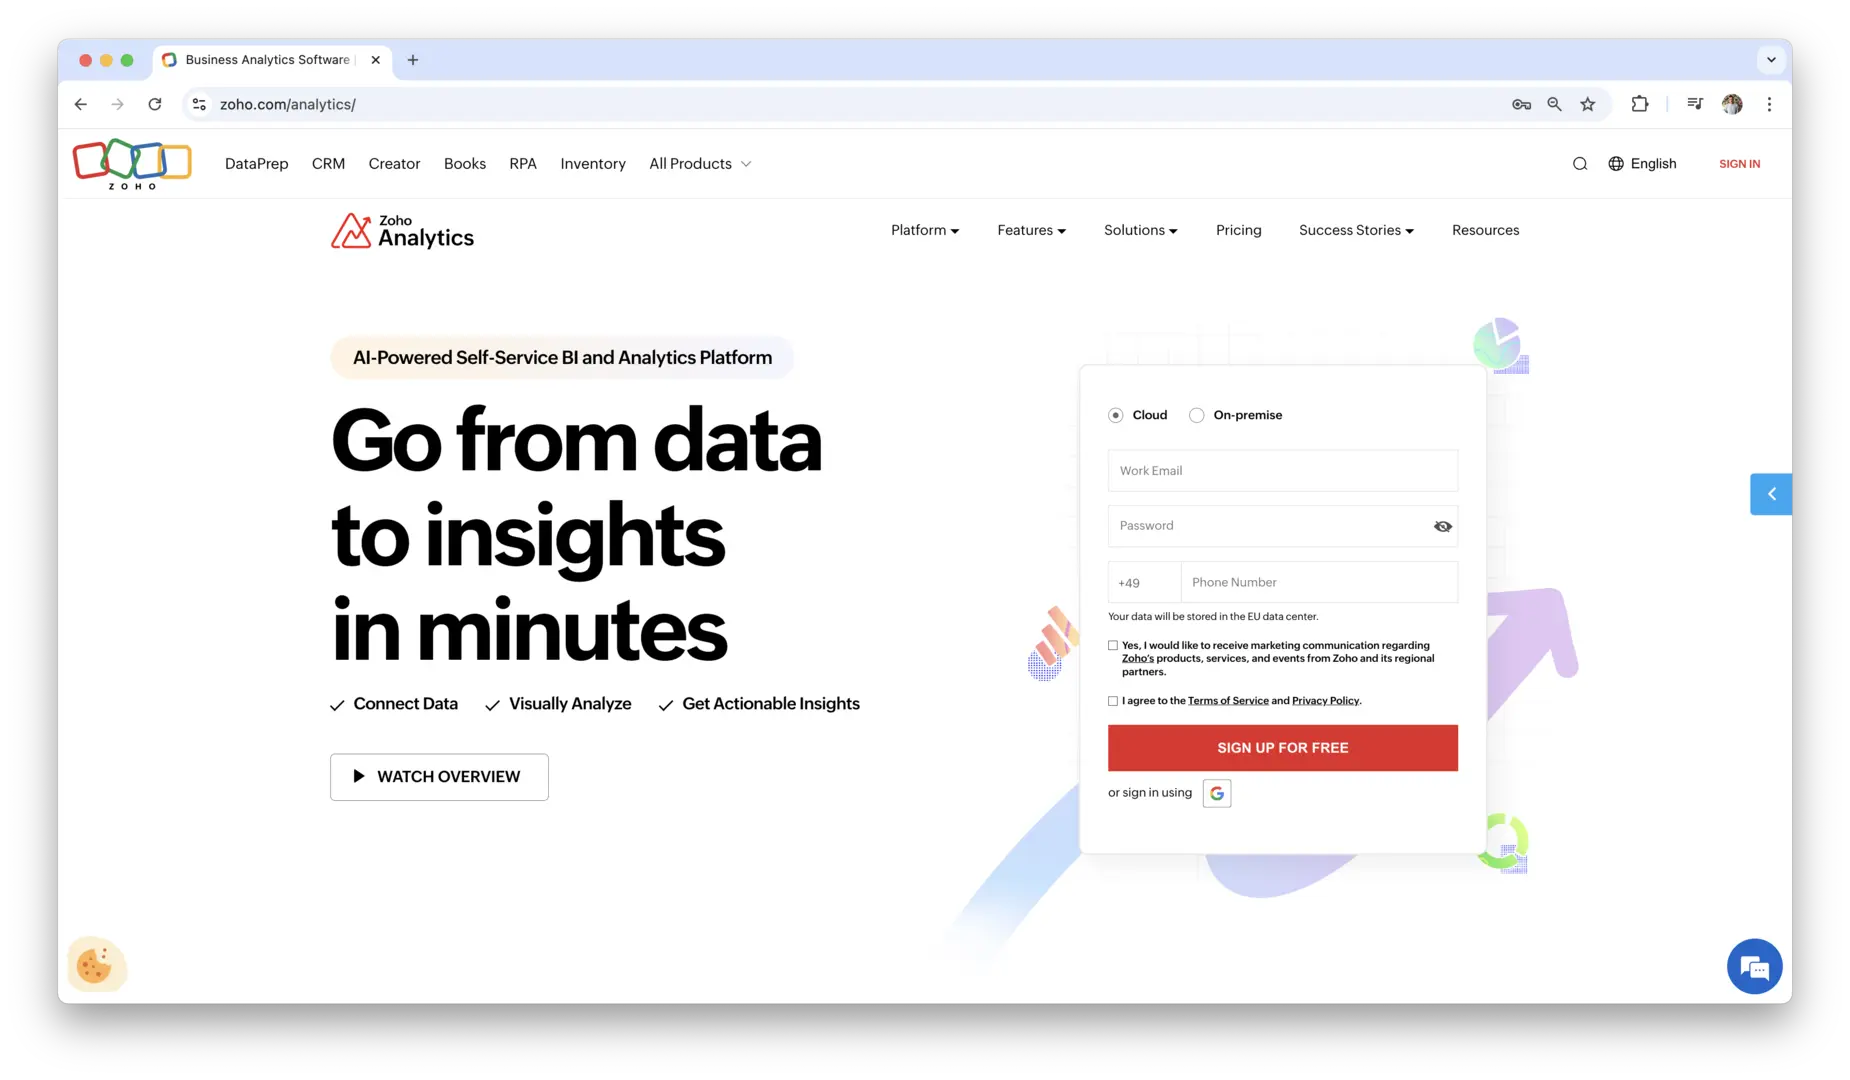
Zoho Analytics is a business intelligence and analytics platform that provides users with powerful tools for creating custom dashboards, reports, and data visualizations. It allows businesses to connect data from a wide variety of sources, including CRM systems, spreadsheets, and third-party applications. Zoho Analytics is known for its ease of use, offering a simple drag-and-drop interface that makes creating custom reports and dashboards a breeze.
What sets Zoho Analytics apart is its ability to integrate with a broad range of applications within the Zoho ecosystem, making it an excellent choice for businesses already using Zoho CRM, Zoho Projects, or other Zoho tools. The platform is particularly strong in its reporting features, allowing businesses to generate detailed reports and insights based on real-time data.
IBM Cognos Analytics
IBM Cognos Analytics is a comprehensive business intelligence platform that offers advanced data visualization, reporting, and analytics features. The tool is designed to help businesses create custom dashboards that provide deep insights into their data. IBM Cognos stands out for its AI-powered features, including automated data preparation, predictive analytics, and natural language queries, which make it easier for users to generate insights without needing advanced analytics expertise.
IBM Cognos is particularly suitable for large enterprises due to its scalability and ability to handle large volumes of data. The software integrates with a variety of databases, cloud platforms, and business systems, making it a robust solution for businesses looking for a comprehensive dashboard tool with advanced capabilities.
Databox
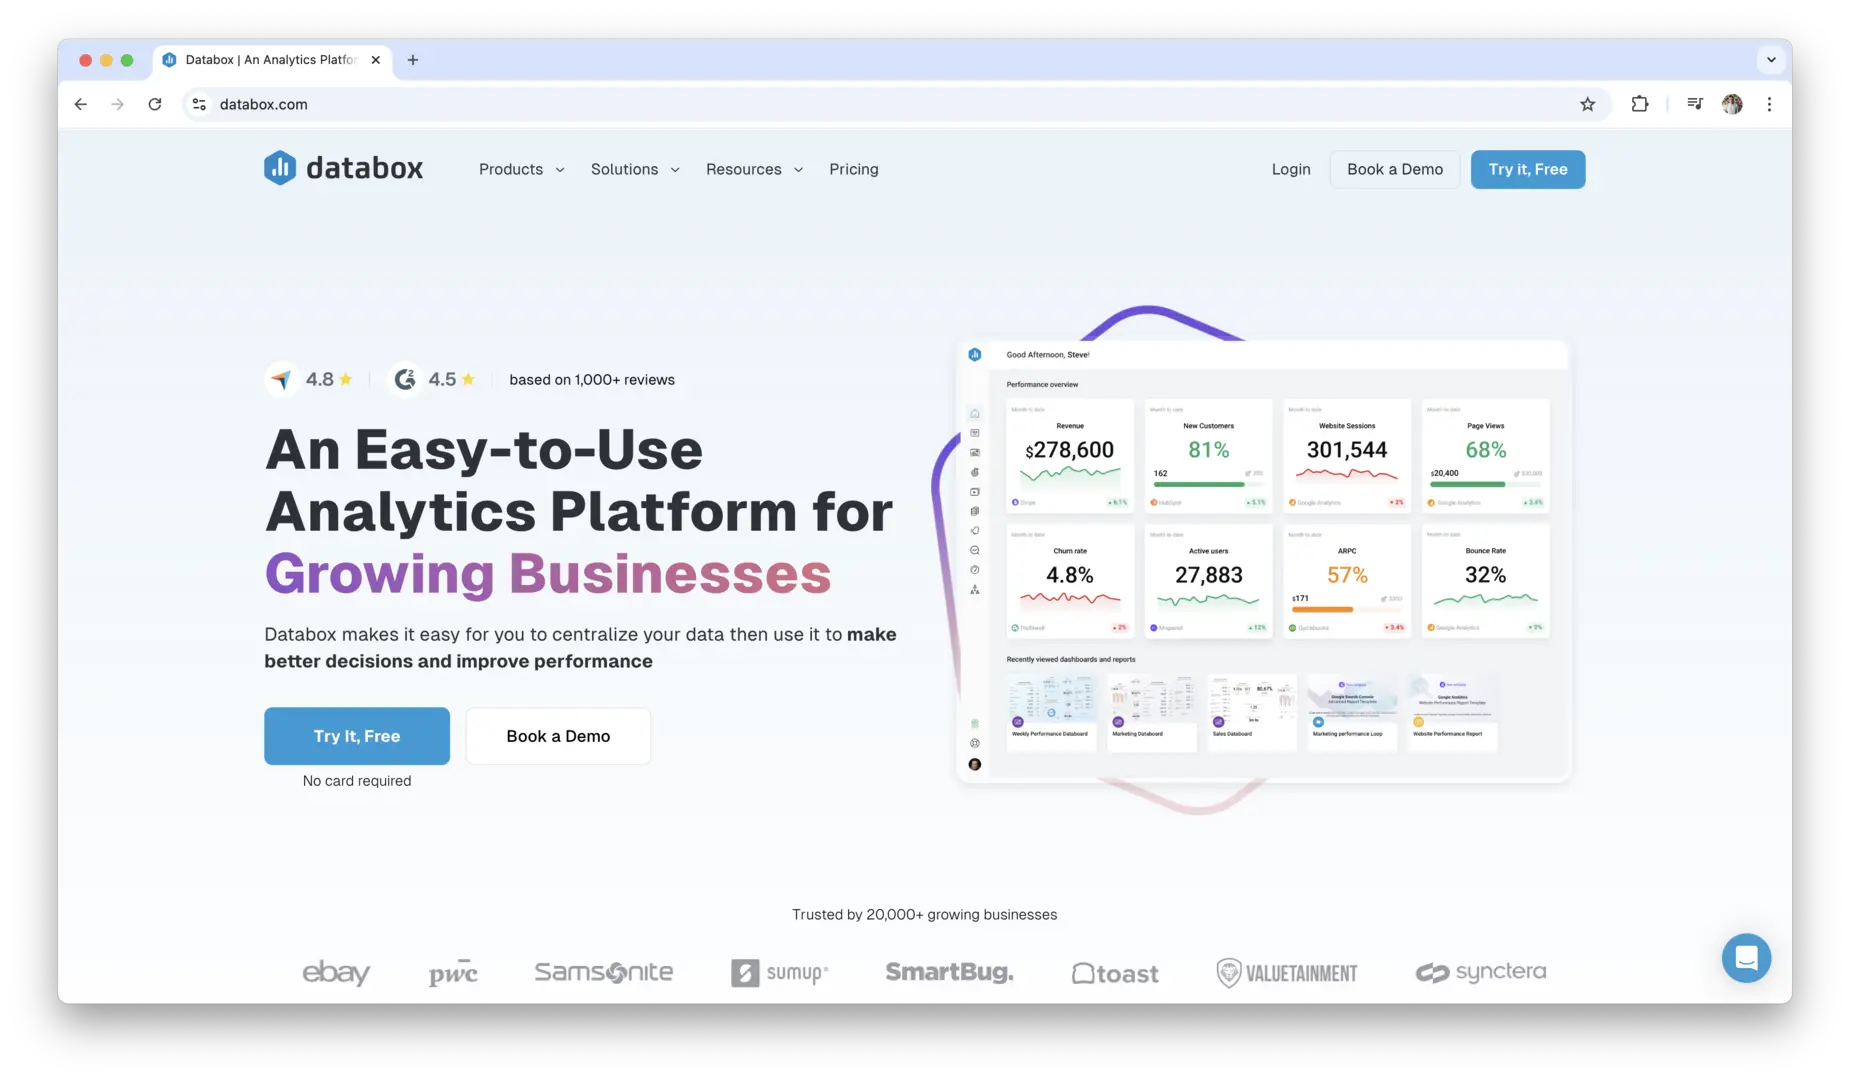
Databox is a business intelligence platform that focuses on providing businesses with real-time data tracking and performance monitoring. It allows users to create visually appealing, interactive dashboards that consolidate data from various sources, including Google Analytics, HubSpot, and Salesforce. Databox offers pre-built templates to help users quickly set up their dashboards, as well as customization options to tailor the dashboards to their specific needs.
What sets Databox apart is its focus on simplicity and accessibility. The platform is easy to use and provides users with easy-to-understand visualizations and real-time metrics that can be shared with teams or clients. It’s a great tool for marketing teams, sales teams, and small to mid-sized businesses looking for a straightforward dashboard solution.
TIBCO Spotfire
TIBCO Spotfire is an advanced analytics and data visualization tool that helps businesses transform their data into actionable insights. The platform is known for its powerful data analytics features, including predictive analytics, machine learning, and AI-based insights. Spotfire is ideal for businesses that require deep data analysis and real-time reporting across multiple departments, such as finance, operations, and marketing.
TIBCO Spotfire provides highly customizable dashboards that allow businesses to monitor their most important KPIs and track performance across various data sources. It also supports advanced visualizations like heatmaps and geographical mapping, making it a top choice for businesses in industries such as healthcare, manufacturing, and energy.
Microsoft Excel with Power Pivot and Power Query
While Excel is often thought of as a spreadsheet tool, its integration with Power Pivot and Power Query makes it a highly capable dashboard solution for businesses looking for a familiar and flexible platform. Power Pivot allows users to perform advanced data modeling, while Power Query enables easy data import and transformation.
Microsoft Excel’s ability to integrate with a wide range of data sources and create pivot tables, charts, and custom reports makes it an excellent tool for smaller businesses or those who are already comfortable using Excel. For companies that don’t need the full power of dedicated business intelligence software, Excel with Power Pivot and Power Query can offer a cost-effective solution for dashboard creation.
Grow
Grow is a user-friendly business intelligence platform that allows teams to create customized dashboards to track performance metrics. It offers integrations with a wide variety of data sources, including CRMs, marketing tools, and eCommerce platforms, making it ideal for businesses that need to pull in data from multiple systems.
Grow’s strength lies in its simplicity. The tool is designed for non-technical users, allowing anyone to create powerful, data-driven dashboards without needing advanced coding or analytics skills. With its real-time data tracking, easy-to-use interface, and pre-built templates, Grow is an excellent choice for small to medium-sized businesses looking to streamline their data monitoring and decision-making processes.
These tools represent the best in class for dashboard software, each offering powerful features and integrations tailored to different business needs. Whether you are a small business looking for simplicity and ease of use or a large enterprise in need of advanced analytics, there is a dashboard solution that can fit your specific requirements.
Dashboard Software Features to Look For
Choosing the right dashboard software can be a daunting task, especially with the variety of options available. But by focusing on key features, you can find the solution that best fits your business needs. Here’s what to prioritize when evaluating dashboard software.
Customization Options
Customization is one of the most important factors to consider when selecting dashboard software. After all, no two businesses have the same requirements, and your dashboard should reflect your unique needs and preferences. Customization allows you to tailor your dashboards to display the most relevant metrics in a way that makes sense for your team.
The best dashboard software gives you flexibility in how you design your workspace. Look for tools that allow you to adjust layout settings, select specific data to display, and customize visual elements like colors, graphs, and charts. Some software also offers pre-designed templates that you can modify to suit your business. The more customization available, the easier it will be to create a dashboard that truly works for your team.
For example, if you are a marketing manager, you may want a dashboard that emphasizes website traffic, conversion rates, and campaign performance. On the other hand, a sales manager might focus on lead generation, revenue, and sales performance. The ability to adjust these settings ensures that each team member has a personalized, user-friendly experience.
Data Integration Capabilities
In today’s data-driven world, businesses use multiple platforms to track and manage different aspects of their operations. Your dashboard software should be able to integrate seamlessly with the various systems you already use, whether it’s a CRM, marketing software, or analytics tools. Without proper integration, your dashboard may not provide an accurate or complete view of your business performance.
Look for dashboard software that supports integrations with common third-party platforms, such as Salesforce, HubSpot, Google Analytics, social media platforms, and finance tools like QuickBooks. This will ensure that your dashboard pulls data in real time from all the sources you need, giving you a comprehensive, up-to-date view of your operations.
The more integrations your dashboard software supports, the easier it will be to bring together data from different parts of your business, resulting in more insightful and actionable visualizations. Some software even offers API capabilities, allowing you to connect to custom-built applications or unique data sources.
User-Friendliness and Interface Design
A great dashboard is only effective if your team can use it easily. When evaluating dashboard software, pay close attention to its user interface (UI). A clean, intuitive design can significantly reduce the learning curve and help your team become productive quickly.
The best dashboard tools offer a straightforward interface that requires minimal training. Features should be easy to locate, and the navigation should be logical and organized. For example, drag-and-drop functionality for designing dashboards or creating custom reports makes it simple for non-technical users to build their visualizations.
Dashboard software that includes an interactive, dynamic interface is even better. This allows your team to explore data more freely, drill down into details, and make real-time adjustments. For example, a sales manager might want to explore specific regions or time periods to analyze performance more granularly. A user-friendly interface makes this possible without needing advanced technical skills.
Additionally, responsive design is essential. Your dashboard should be accessible and easy to use on various devices, including mobile phones and tablets. This ensures that team members can stay updated on business metrics, no matter where they are working.
Real-Time Data Updates and Visualization Accuracy
The speed at which your data updates can make or break the effectiveness of your dashboard. In fast-paced business environments, real-time data updates are crucial. They allow you to monitor the performance of marketing campaigns, track sales numbers, or manage customer support metrics in real time.
Real-time updates allow you to react quickly to changes and adjust strategies on the fly. Imagine you’re monitoring a promotional campaign, and you see that a specific channel is underperforming. With real-time updates, you can make immediate adjustments to redirect resources or modify the campaign to improve results. This level of agility can make a huge difference in staying ahead of the competition.
Equally important is the accuracy of your data visualizations. Dashboards are designed to present complex information in an easy-to-understand format, but if the underlying data is inaccurate or outdated, your decisions will be based on faulty information. Ensure that the dashboard software you choose provides reliable and accurate visualizations that reflect the most recent data.
When reviewing software options, ask about the refresh rate and data update frequency. This ensures that your dashboard remains relevant and actionable, especially when you rely on metrics to drive key decisions in a timely manner.
Security and Data Privacy Considerations
With the increasing reliance on cloud-based software, security is a top priority when choosing dashboard software. The data you track in your dashboard could contain sensitive business information, such as financial data, customer details, and internal performance metrics. It’s vital to ensure that your dashboard software protects this data from breaches and unauthorized access.
Look for dashboard tools that are compliant with industry-standard security certifications, such as SOC 2 Type II, ISO 27001, or GDPR. These certifications ensure that the software meets strict security standards for data protection. You should also check for features like role-based access controls, which allow you to control who can view and modify data on the dashboard.
Encryption is another key feature to look for. Any data transmitted through the software should be encrypted to prevent interception or unauthorized access. Additionally, choose software that offers data redundancy and backup systems to prevent data loss.
When it comes to privacy, ensure that the dashboard software you choose has clear policies regarding data storage, usage, and sharing. If you’re handling sensitive customer data, verify that the tool complies with regulations like GDPR or CCPA to avoid legal risks.
In conclusion, security should never be overlooked when selecting dashboard software. Make sure to evaluate the platform’s security features and confirm that they align with your business’s data protection requirements.
How to Choose the Best Dashboard Software for Your Needs?
Selecting the best dashboard software for your business is a critical decision that depends on a variety of factors. It’s not just about picking the most feature-packed option, but finding one that fits the unique needs of your business, team, and goals. The right dashboard software will make it easier for you to monitor performance, track progress, and make data-driven decisions.
Choosing the right software requires evaluating your business size and complexity, understanding what you want to achieve, and ensuring the solution can scale as your business grows. Let’s dive into how to approach these considerations.
Assessing Business Size and Complexity
The size and complexity of your business should directly influence your decision on dashboard software. If you’re part of a small team or a startup, you might not need an enterprise-level solution with all the bells and whistles. Conversely, a large corporation will require a more robust tool that can handle vast amounts of data, complex reporting, and multiple users across departments.
For small to medium-sized businesses, look for software that offers simplicity and ease of use without overwhelming features. Tools like Google Looker Studio or Klipfolio are great for smaller businesses that need easy-to-use interfaces with essential features like real-time data tracking and simple visualizations. These platforms are also cost-effective, making them perfect for companies with limited budgets.
For larger companies with more intricate operations, you’ll need something more advanced that can integrate data from multiple sources, handle large datasets, and offer customizable reporting features. Solutions like Power BI or Tableau are excellent choices for businesses of this size. These tools allow for deeper data analysis, better control over data visualization, and the ability to create detailed, enterprise-grade reports.
In assessing your business size and complexity, also consider how many users will be accessing the software. Do you need something that can be used across multiple departments or by just a small team? Will you need to give access to external stakeholders, such as investors or clients? Make sure the software can accommodate your user requirements and offers the right permissions and access levels.
Defining Your Objectives
Knowing exactly what you want to achieve with your dashboard software is crucial. Your objectives will shape the way you use the software and the features you prioritize. Whether you’re tracking KPIs, financial metrics, or facilitating team collaboration, clearly defining your goals will help you select a dashboard that meets your needs.
If your main goal is monitoring KPIs, you’ll want software that allows for easy data visualization and the ability to track specific metrics in real time. For example, marketing teams might focus on metrics like website traffic, conversion rates, or campaign performance, while sales teams might prioritize lead generation, closed deals, and revenue growth. Make sure the dashboard software allows you to customize the metrics you track and the way they’re displayed.
For businesses focused on financial metrics, you’ll need a dashboard that integrates seamlessly with your accounting or finance software. A solution like Tableau or Power BI offers advanced financial analysis and reporting tools, allowing you to pull data from your accounting system and create comprehensive financial dashboards. These tools can help you track profit margins, cash flow, expenses, and other key financial data points that are critical for long-term success.
Another common objective is improving team collaboration and transparency. If you need software that helps teams work together in real-time, look for tools that allow for easy sharing, communication, and access control. For example, Google Looker Studio is excellent for teams that need to collaborate on dashboard creation and share live reports with others.
Take some time to evaluate your specific objectives and how they align with the features of the software. The best dashboard tools offer flexibility, allowing you to focus on the metrics and goals that matter most to your business.
Considerations for Scalability and Long-Term Use
As your business grows, your dashboard software should grow with it. Scalability is a key factor in ensuring that the software remains useful and efficient as your needs evolve over time. Even if your business is small right now, you should choose software that can handle larger datasets, additional users, and more complex data visualizations in the future.
Look for dashboard software that offers flexibility in how it scales. Does it allow you to add more users, integrate more data sources, or add more customization options as you need them? Power BI and Tableau are both excellent examples of scalable solutions, as they offer enterprise-level capabilities but can be adjusted to suit businesses of all sizes.
Additionally, think about the long-term viability of the software. You don’t want to invest in a solution that’s just a temporary fix. The best dashboard software should be a tool that can grow alongside your business needs. Look for platforms that receive regular updates, new features, and robust customer support. This ensures that you’ll continue to get value from the tool as it evolves and that you can rely on the software to handle new challenges as your business expands.
Another consideration is how easy it is to upgrade your software as your needs change. Some dashboard tools offer flexible pricing plans that allow you to scale up or down depending on your usage, while others may lock you into a fixed plan. Be sure to choose a tool with a pricing model that supports your growth and gives you the freedom to adjust as needed.
In conclusion, scalability isn’t just about having more users or data; it’s about ensuring that the dashboard software continues to meet your needs as your business changes. Think about where your business is headed in the next few years and choose a dashboard solution that will adapt to those needs. This foresight will save you time, effort, and money in the long run.
Dashboard Software Use Cases
Dashboard software can be applied in a wide range of industries and business functions, helping teams across the board track performance, optimize processes, and make data-driven decisions. Below are several real-world examples of how businesses use dashboard software to improve efficiency, transparency, and overall decision-making:
- Marketing teams use dashboards to monitor campaign performance, track website traffic, and visualize engagement metrics across different channels. By integrating data from platforms like Google Analytics and social media, they can quickly identify trends, optimize strategies, and allocate resources more effectively.
- Sales teams rely on dashboards to track their lead generation efforts, sales pipelines, and revenue targets. Dashboards help visualize performance data in real-time, enabling managers to identify bottlenecks, improve conversion rates, and streamline sales processes.
- Customer service departments use dashboards to monitor customer satisfaction, response times, and case resolution metrics. By pulling data from their CRM system or help desk software, service teams can quickly assess performance and identify areas for improvement.
- Human resources leverage dashboards to track employee performance, turnover rates, and hiring progress. HR dashboards consolidate data from various sources to monitor recruitment campaigns, training completion, and employee engagement, helping HR managers make informed decisions.
- Finance departments use dashboards to visualize financial data, such as cash flow, profit margins, and expenses. These dashboards pull from accounting software to provide real-time insights into the company’s financial health, helping financial analysts and executives make timely financial decisions.
- Project management teams use dashboards to track project progress, milestones, deadlines, and resource allocation. By consolidating data from project management tools like Trello or Asana, they can monitor team performance and ensure projects stay on schedule.
- Operations teams use dashboards to optimize workflow, monitor key operational metrics, and track inventory. They can see how processes are performing, spot inefficiencies, and identify opportunities for improvement across various departments.
- Executive leadership uses dashboards to view high-level KPIs, strategic initiatives, and overall company performance. Dashboards offer a bird’s-eye view of the organization’s health, allowing executives to make data-backed decisions that align with long-term goals.
Dashboard Software Best Practices
To maximize the value of your dashboard software and ensure it delivers the insights you need, there are several best practices to follow. These practices will help streamline data visualization, improve collaboration, and ensure your team makes the most out of the dashboard’s capabilities:
- Define clear objectives for your dashboard before creating it. Know what metrics you need to track and why. Align the dashboard with your business goals to ensure it provides actionable insights.
- Choose relevant KPIs that reflect the health of your business. Avoid cluttering the dashboard with too many metrics; focus on the ones that truly matter.
- Keep the design simple and clean. A cluttered dashboard can overwhelm users. Use a minimalist design that prioritizes the most important data and visualizations.
- Make your dashboards interactive. Allow users to drill down into the data for more detailed insights. Interactive features make it easier to explore the data and uncover trends that may not be obvious at first glance.
- Regularly update your dashboards to ensure that the data is current and accurate. Real-time data updates help users make timely decisions based on the most recent information.
- Customize dashboards for different teams. Not everyone needs to see the same data. Tailor dashboards to the specific needs of different departments, such as sales, marketing, or finance, so each team can focus on their most relevant metrics.
- Ensure mobile access to dashboards so that users can view performance metrics on-the-go. Many dashboard software tools offer mobile apps, which are especially useful for executives and field teams.
- Train your team on how to use the dashboard software effectively. Provide training sessions or resources to ensure everyone understands how to interpret the data and utilize the dashboard’s features.
- Set up alerts and notifications for key changes or performance thresholds. Automated alerts can help you stay on top of important developments without having to constantly monitor the dashboard.
- Regularly review and refine your dashboards. As your business evolves, your data needs and goals will change. Periodically evaluate and update your dashboards to ensure they continue to meet your objectives.
By following these best practices, you can ensure that your dashboard software is an invaluable tool for your business, helping you track performance, make data-driven decisions, and stay on top of your goals.
Conclusion
Choosing the right dashboard software can significantly improve how you monitor and analyze your business performance. With the right tool, you can streamline your data, get real-time insights, and make decisions faster. Whether you’re a small business owner or part of a large enterprise, there’s a dashboard solution that fits your needs. From user-friendly options like Google Looker Studio to powerful platforms like Power BI and Tableau, each software offers unique features that cater to different business goals. The key is to prioritize what matters most to you—whether it’s customization, data integration, or ease of use—and select a tool that aligns with your objectives.
Remember, a good dashboard software solution not only helps you visualize your data but also empowers you to take action based on what you see. By simplifying complex data into easy-to-understand visuals, these tools allow you to stay on top of your KPIs and track your progress toward your goals. As your business grows and evolves, your dashboard software should evolve with it, offering scalability and adaptability for new data sources and more users. Take your time to evaluate your options, and you’ll find a dashboard that helps drive smarter, more informed decisions for your business.
Get Started With a Prebuilt Template!
Looking to streamline your business financial modeling process with a prebuilt customizable template? Say goodbye to the hassle of building a financial model from scratch and get started right away with one of our premium templates.
- Save time with no need to create a financial model from scratch.
- Reduce errors with prebuilt formulas and calculations.
- Customize to your needs by adding/deleting sections and adjusting formulas.
- Automatically calculate key metrics for valuable insights.
- Make informed decisions about your strategy and goals with a clear picture of your business performance and financial health.


