
Welcome to a world of enhanced productivity and streamlined workflows with the power of top free Google Sheets templates. In this list, we will explore a diverse range of Google Sheets templates that can transform the way you manage projects, analyze data, track expenses, and more.
Whether you’re a business professional, an entrepreneur, or a student, these Google Sheets templates will empower you to work smarter, make informed decisions, and achieve your goals. So, let’s dive in and unlock the true potential of Google Sheets templates!
Capital Expenditure Planning Template
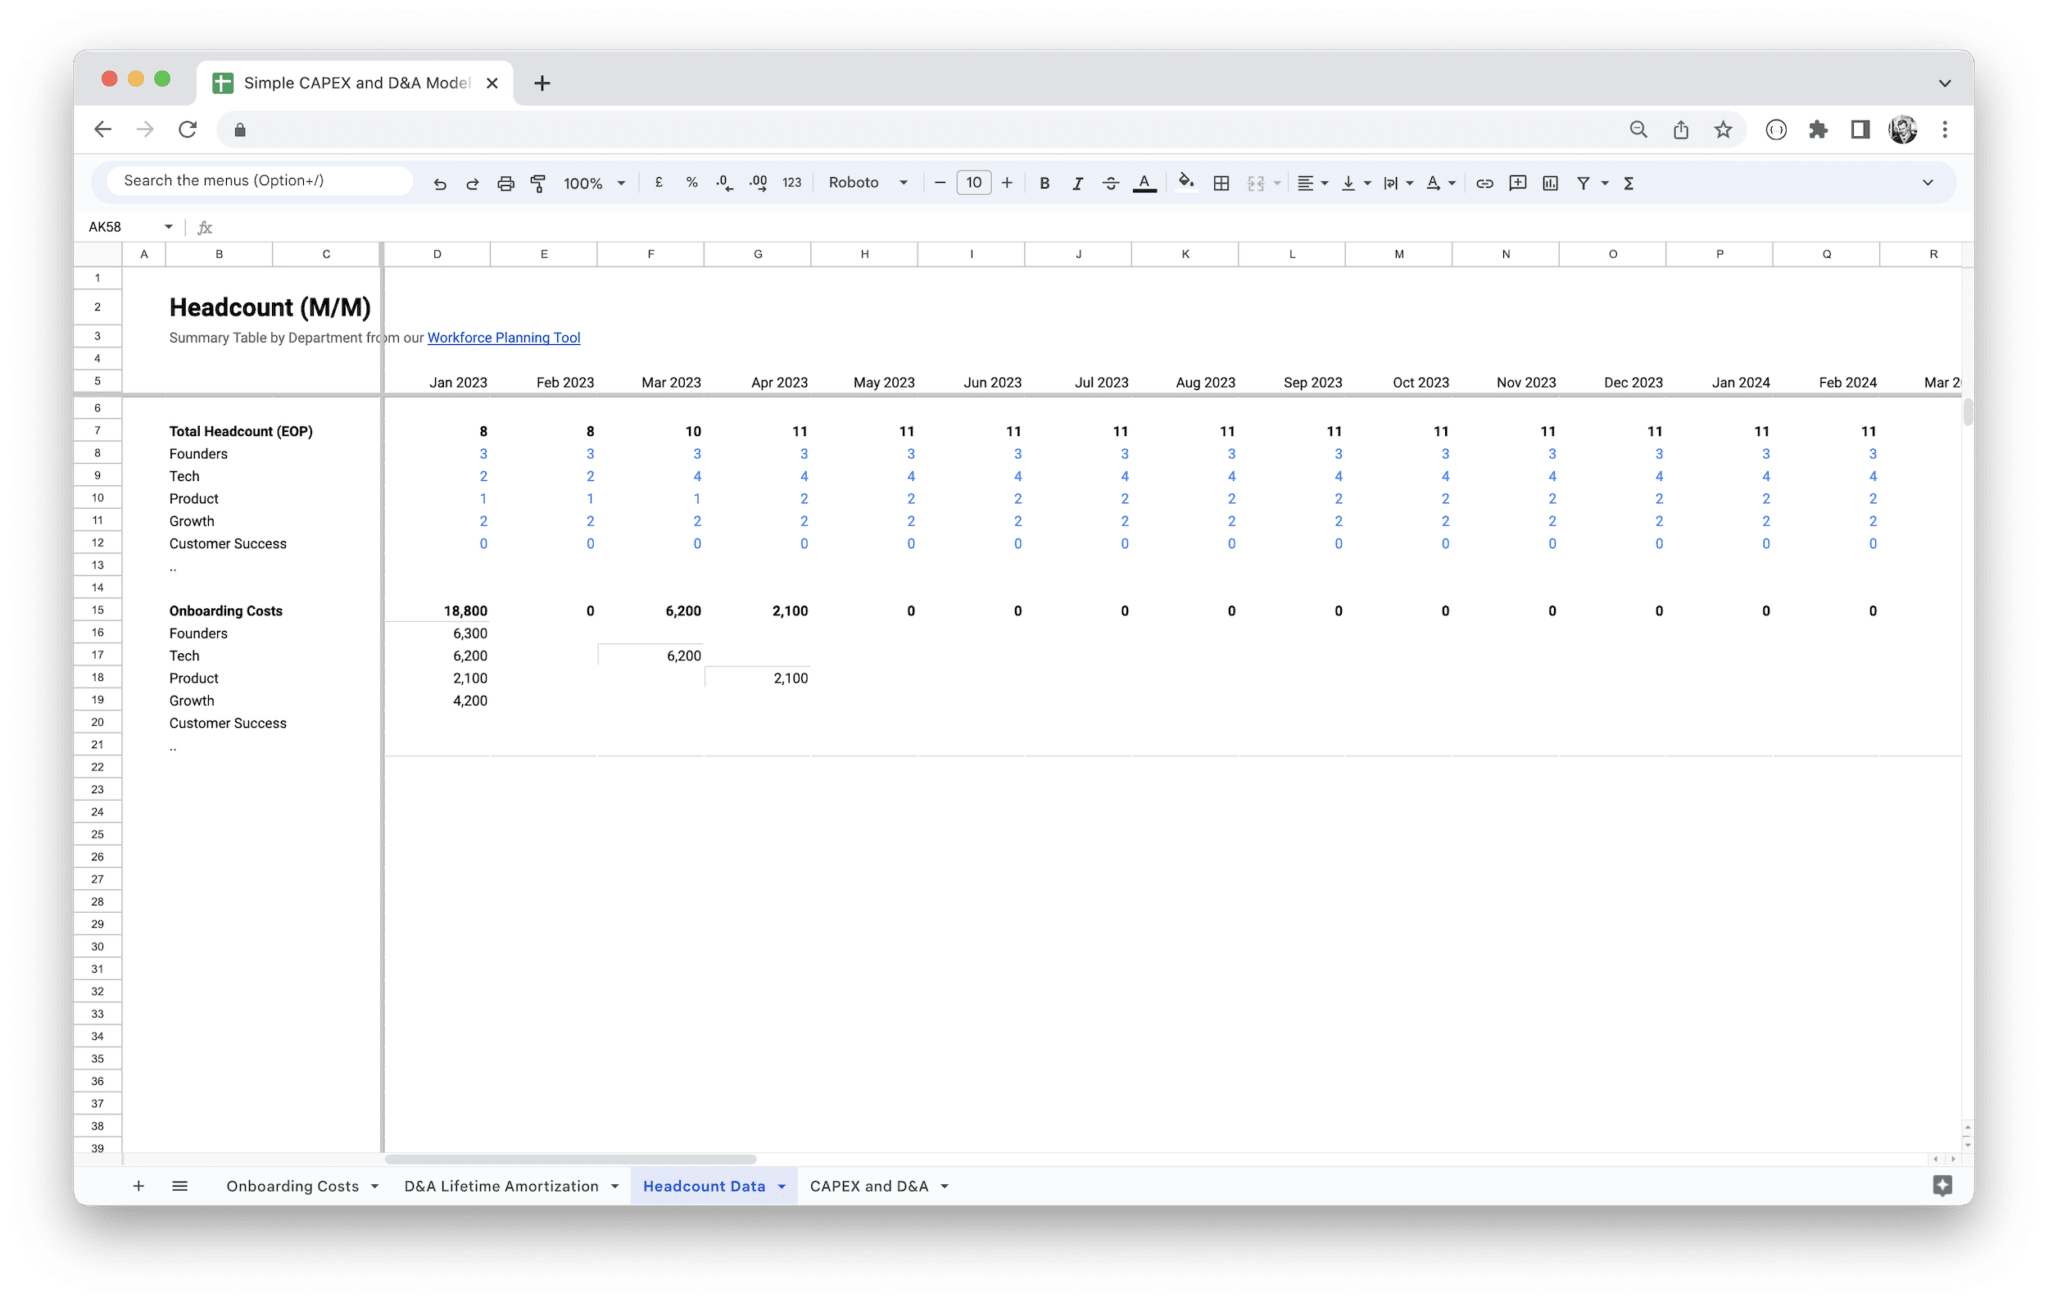

Capital Expenditure Planning is a critical process that helps businesses effectively manage and allocate resources for long-term investments. From infrastructure upgrades to equipment purchases, having a structured plan is essential for financial stability and growth. The Capital Expenditure Planning Template in Google Sheets simplifies this process by providing a pre-designed framework to track and analyze capital expenses.
How to Use the Capital Expenditure Planning Template?
- Open the Capital Expenditure Planning Template.
- Make a copy of the template to your Google Drive.
- Customize the template by entering your company’s specific information, such as project names, estimated costs, and projected timelines.
- Use the template’s built-in formulas and features to automatically calculate totals, variances, and other important financial metrics.
- Monitor the progress of your capital expenditure projects, track actual expenses, and compare them against the initial budget.
- Generate reports and visualizations based on the data entered to gain insights into your company’s capital expenditure trends.
Key Features and Sections of the Template
The Capital Expenditure Planning Template typically includes the following sections:
- Project Name: Enter the name of each capital expenditure project.
- Description: Provide a brief overview of the project’s objectives and scope.
- Estimated Cost: Enter the projected cost of each project.
- Actual Cost: Update this field as you incur actual expenses during the project’s execution.
- Budget Variance: Automatically calculated based on the estimated and actual costs, this field shows the difference between the two.
- Timeline: Specify the project’s start and end dates.
- Status: Track the progress of each project, whether it’s in the planning, implementation, or completion stage.
- Notes: Add any additional information or comments relevant to the project.
Tips for Effective Capital Expenditure Planning Using the Template
- Review and update your Capital Expenditure Planning Template regularly to ensure accurate and up-to-date information.
- Consult with stakeholders and finance professionals when estimating costs and setting project budgets.
- Consider using conditional formatting to highlight budget variances or nearing project deadlines.
- Leverage the template’s data visualization capabilities to create charts or graphs for better presentation of financial insights.
- Regularly analyze your capital expenditure trends to identify cost-saving opportunities or potential risks.
User Engagement Dashboard Template
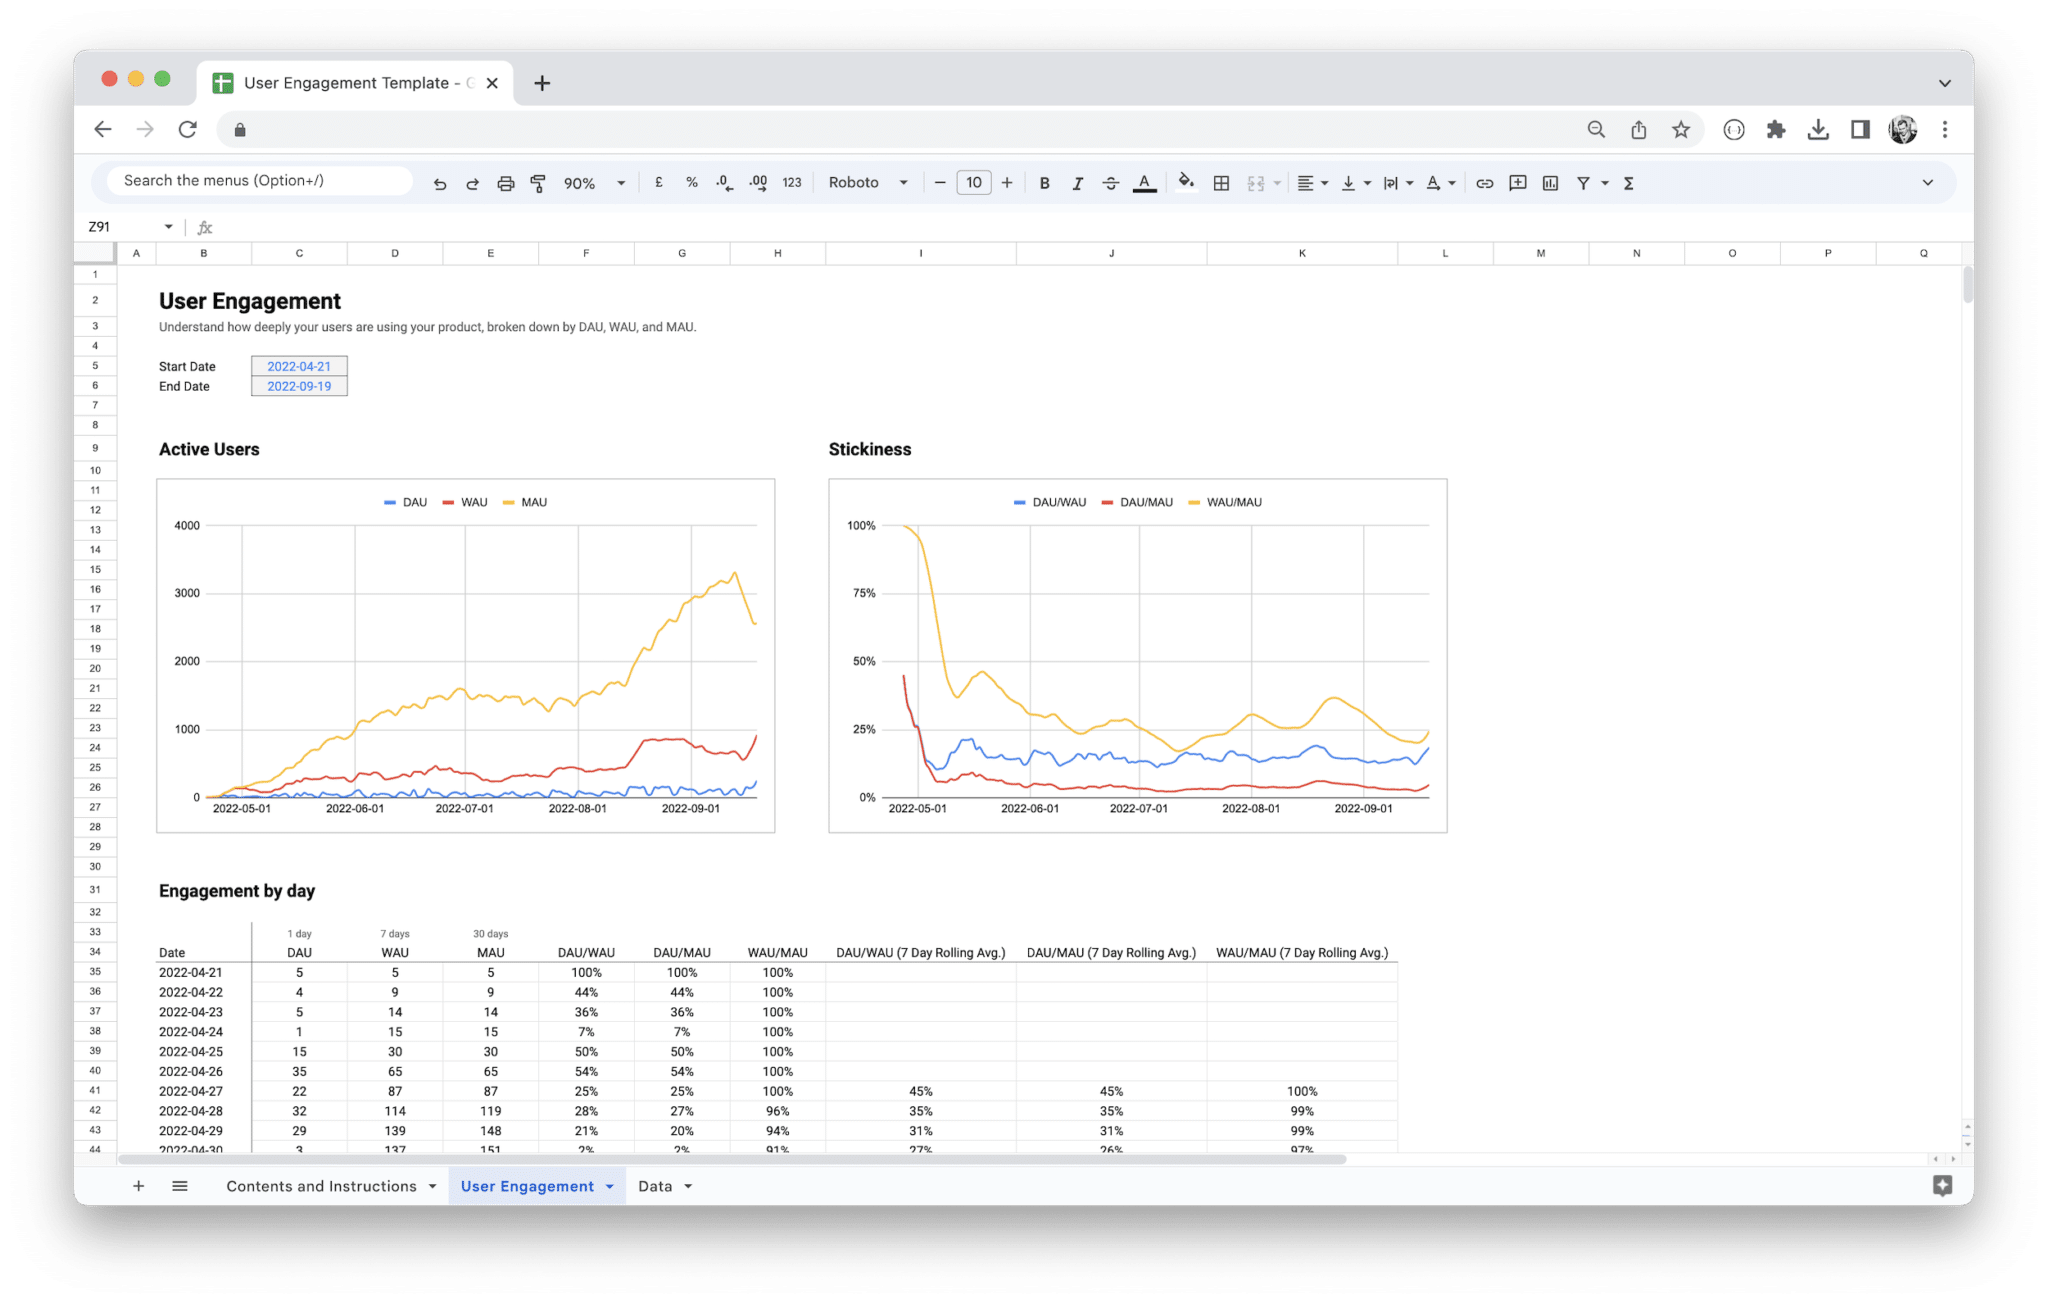
User engagement plays a crucial role in the success of online businesses, websites, and applications. Monitoring user engagement metrics provides valuable insights into user behavior, satisfaction, and the effectiveness of marketing strategies. The User Engagement Dashboard Template in Google Sheets offers a comprehensive framework to track and analyze key user engagement metrics.
How to Effectively Use the User Engagement Dashboard Template?
- Open the User Engagement Dashboard Template in Google Sheets and make a copy of it.
- Customize the template to align with your specific metrics and goals.
- Connect your website or application analytics tool to automatically import user engagement data into the template.
- Update the template with the imported data and let the built-in formulas calculate the relevant metrics.
- Explore the various visualizations and charts within the template to gain insights into user engagement patterns.
- Set specific goals and track your progress using the template’s goal tracking features.
- Regularly analyze the data and adjust your strategies to improve user engagement.
Key Metrics and Visualizations in the Dashboard
The User Engagement Dashboard Template typically includes the following metrics and visualizations:
- Pageviews: The total number of times a page has been viewed on your website or application.
- Unique Visitors: The count of individual users who have visited your site or app.
- Average Time on Page: The average amount of time users spend on each page.
- Bounce Rate: The percentage of visitors who leave your site after viewing only one page.
- Conversion Rate: The percentage of visitors who complete a desired action, such as making a purchase or signing up for a newsletter.
- Goal Tracking: Track specific goals, such as form submissions or product purchases, and monitor your progress.
- Visualizations: Charts and graphs that represent the user engagement metrics over time, allowing for easy visualization and analysis.
Analyzing User Engagement Patterns and Optimizing Strategies
To effectively analyze user engagement patterns and optimize your strategies, consider the following:
- Identify pages or areas of your website or application with high or low user engagement metrics.
- Determine which sources or channels drive the highest user engagement and focus your marketing efforts accordingly.
- Compare user engagement metrics before and after implementing changes or new features to assess their impact.
- Use the template’s visualization capabilities to identify trends, patterns, and correlations among different user engagement metrics.
- Regularly evaluate user feedback, conduct surveys, or perform usability tests to gain qualitative insights to complement the quantitative metrics.
CLV vs. CAC Analysis Template
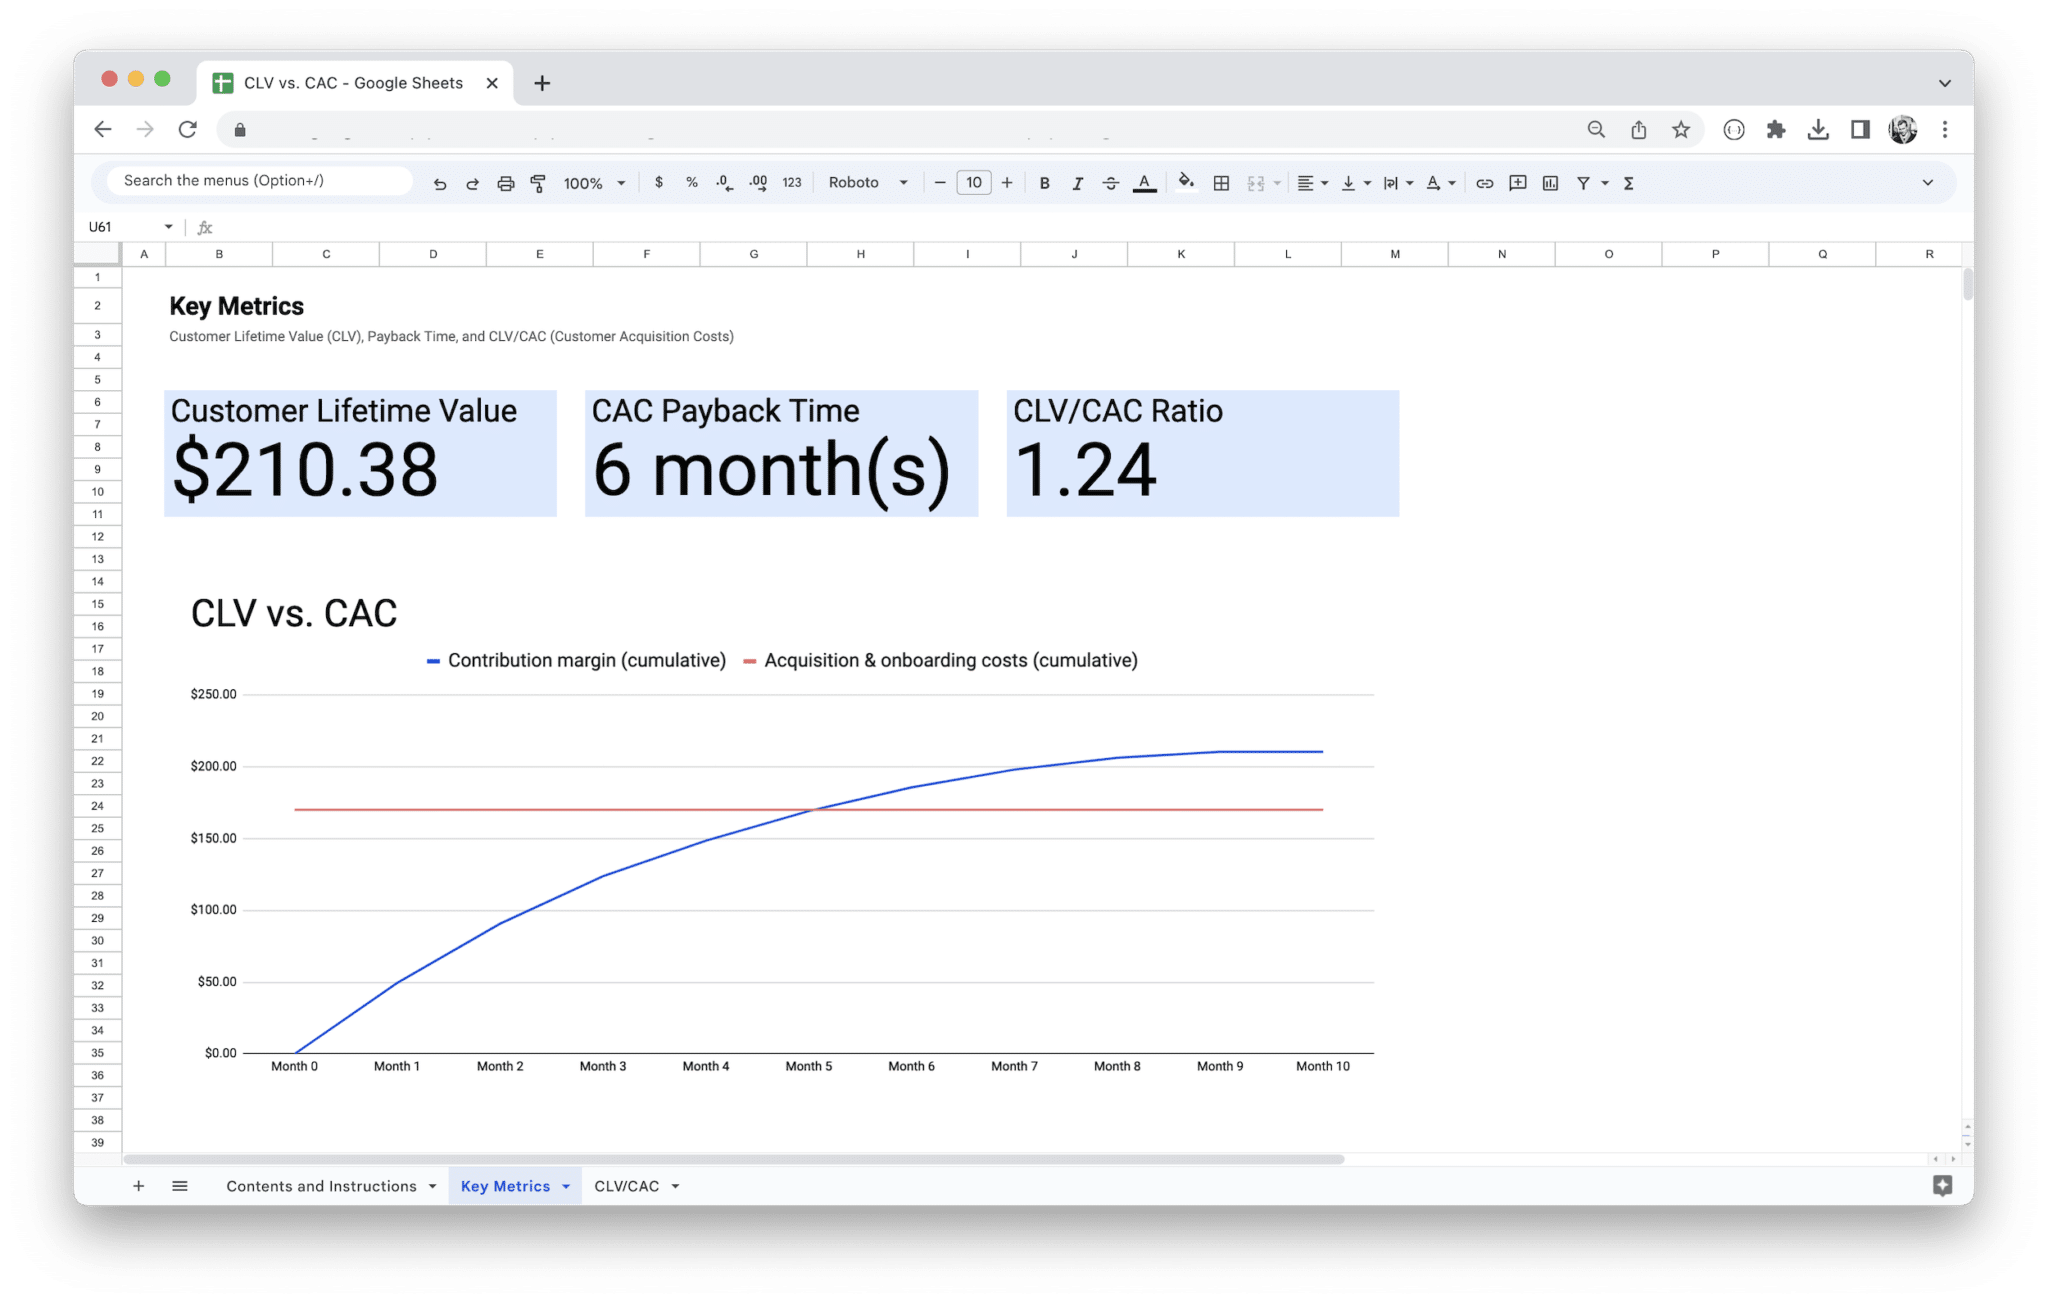
Customer Lifetime Value (CLV) represents the predicted revenue a customer will generate throughout their relationship with your business. Customer Acquisition Cost (CAC), on the other hand, refers to the amount of money spent to acquire a new customer. Analyzing the CLV vs. CAC ratio helps businesses assess the effectiveness of their marketing and customer retention strategies.
How to Utilize the CLV vs. CAC Analysis Template?
- Open the CLV vs. CAC Analysis Template in Google Sheets and make a copy of it.
- Customize the template by entering your business-specific data, such as revenue per customer, acquisition costs, and retention rates.
- Utilize the pre-built formulas in the template to automatically calculate CLV, CAC, and the CLV vs. CAC ratio.
- Analyze the CLV vs. CAC ratio over time to identify trends and assess the effectiveness of your marketing strategies.
- Experiment with different scenarios by adjusting inputs in the template to evaluate the potential impact on the CLV vs. CAC ratio.
- Use the insights gained from the template to optimize your marketing and customer retention efforts.
Analyzing and Interpreting the Results from the Template
When analyzing the CLV vs. CAC ratio using the template, consider the following:
- A higher CLV vs. CAC ratio indicates that the lifetime value of your customers is greater than the cost to acquire them, suggesting profitability.
- A decreasing CLV vs. CAC ratio may signal diminishing returns or an ineffective marketing strategy.
- Monitor the CLV vs. CAC ratio over different time periods to identify seasonality or changes in customer behavior.
- Compare the CLV vs. CAC ratio across different customer segments to assess the profitability of each segment.
- Use the template to perform “what-if” scenarios to explore the impact of different marketing strategies on the ratio.
Optimizing Marketing Strategies Based on CLV vs. CAC Analysis
Once you have analyzed the CLV vs. CAC ratio, consider the following strategies for optimization:
- Focus your marketing efforts on acquiring customers with a higher CLV vs. CAC ratio, as they are more likely to generate long-term revenue.
- Identify areas where you can reduce customer acquisition costs without significantly impacting customer lifetime value.
- Improve customer retention and loyalty programs to increase customer lifetime value and enhance the CLV vs. CAC ratio.
- Continuously monitor and evaluate the impact of marketing campaigns and initiatives on the CLV vs. CAC ratio to make data-driven decisions.
- Regularly update and review the CLV vs. CAC Analysis Template with new data to ensure accurate and relevant insights.
Workforce Planning Tool
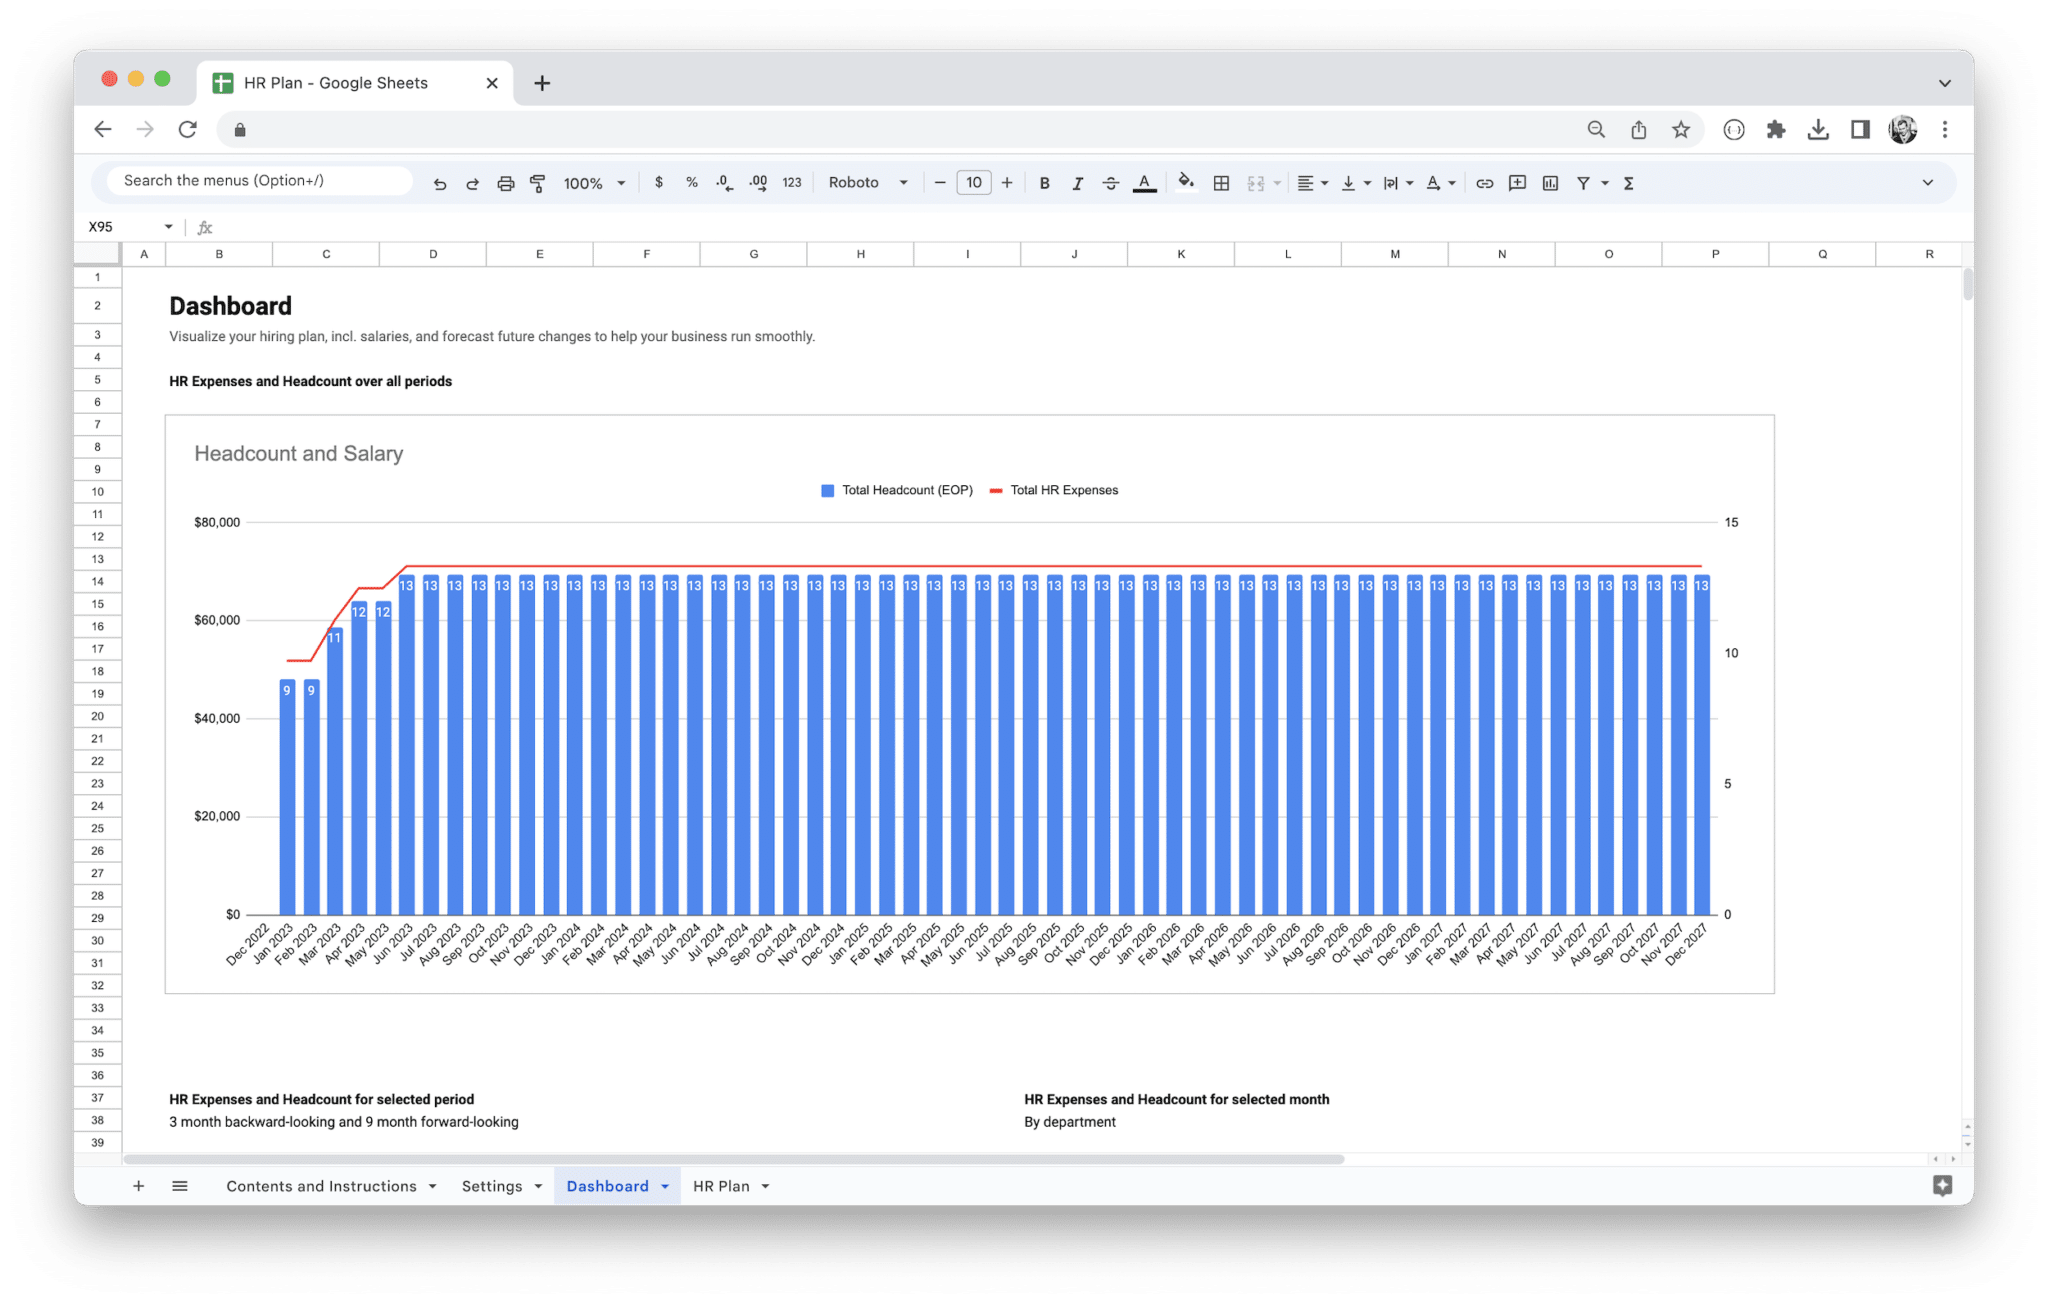
Workforce planning involves assessing your organization’s current and future workforce needs to ensure you have the right people with the right skills in the right positions. It helps businesses effectively manage talent, optimize resource allocation, and adapt to changing market demands. The Workforce Planning Tool in Google Sheets provides a structured framework for conducting workforce planning activities.
Step-by-Step Instructions for Using the Workforce Planning Tool
- Open the Workforce Planning Tool in Google Sheets and make a copy of it.
- Customize the template by entering your organization’s workforce data, such as current employee count, positions, and skills.
- Analyze your organization’s strategic objectives, growth projections, and talent requirements.
- Identify potential workforce gaps or surplus based on your analysis.
- Use the template to assess the impact of workforce changes, such as new hires, promotions, or layoffs, on your organization’s structure and skill distribution.
- Experiment with different scenarios by adjusting inputs in the template to evaluate the potential outcomes.
- Develop strategies and action plans to address workforce gaps or surplus identified through the template’s analysis.
Key Sections and Functionalities of the Tool
The Workforce Planning Tool typically includes the following sections and functionalities:
- Workforce Overview: Provides an overview of your organization’s current workforce, including employee count, departments, and positions.
- Skills Inventory: Helps you assess the skills and competencies available within your organization.
- Workforce Projections: Allows you to estimate future workforce needs based on growth projections or changes in business strategy.
- Gap Analysis: Compares your current workforce to the projected needs, highlighting areas with potential gaps or surplus.
- Scenarios and Simulations: Enables you to model different workforce scenarios and assess their impact on your organization’s structure and skill distribution.
- Action Plans: Provides a framework for developing strategies and action plans to address workforce gaps or surplus.
Strategies for Effective Workforce Planning Using the Template
To make the most out of the Workforce Planning Tool and effectively plan your workforce, consider the following strategies:
- Collaborate with key stakeholders, including HR professionals and department managers, to gather accurate data and insights for the template.
- Regularly update the template with new workforce data to ensure its accuracy and relevance.
- Incorporate external factors, such as industry trends, technological advancements, and regulatory changes, into your workforce planning analysis.
- Leverage the template’s scenario and simulation capabilities to test different workforce strategies and assess their impact.
- Communicate and align your workforce plans with your organization’s overall strategic goals and objectives.
- Continuously monitor and evaluate the effectiveness of your workforce planning efforts and make adjustments as needed.
Cohort Analysis Template
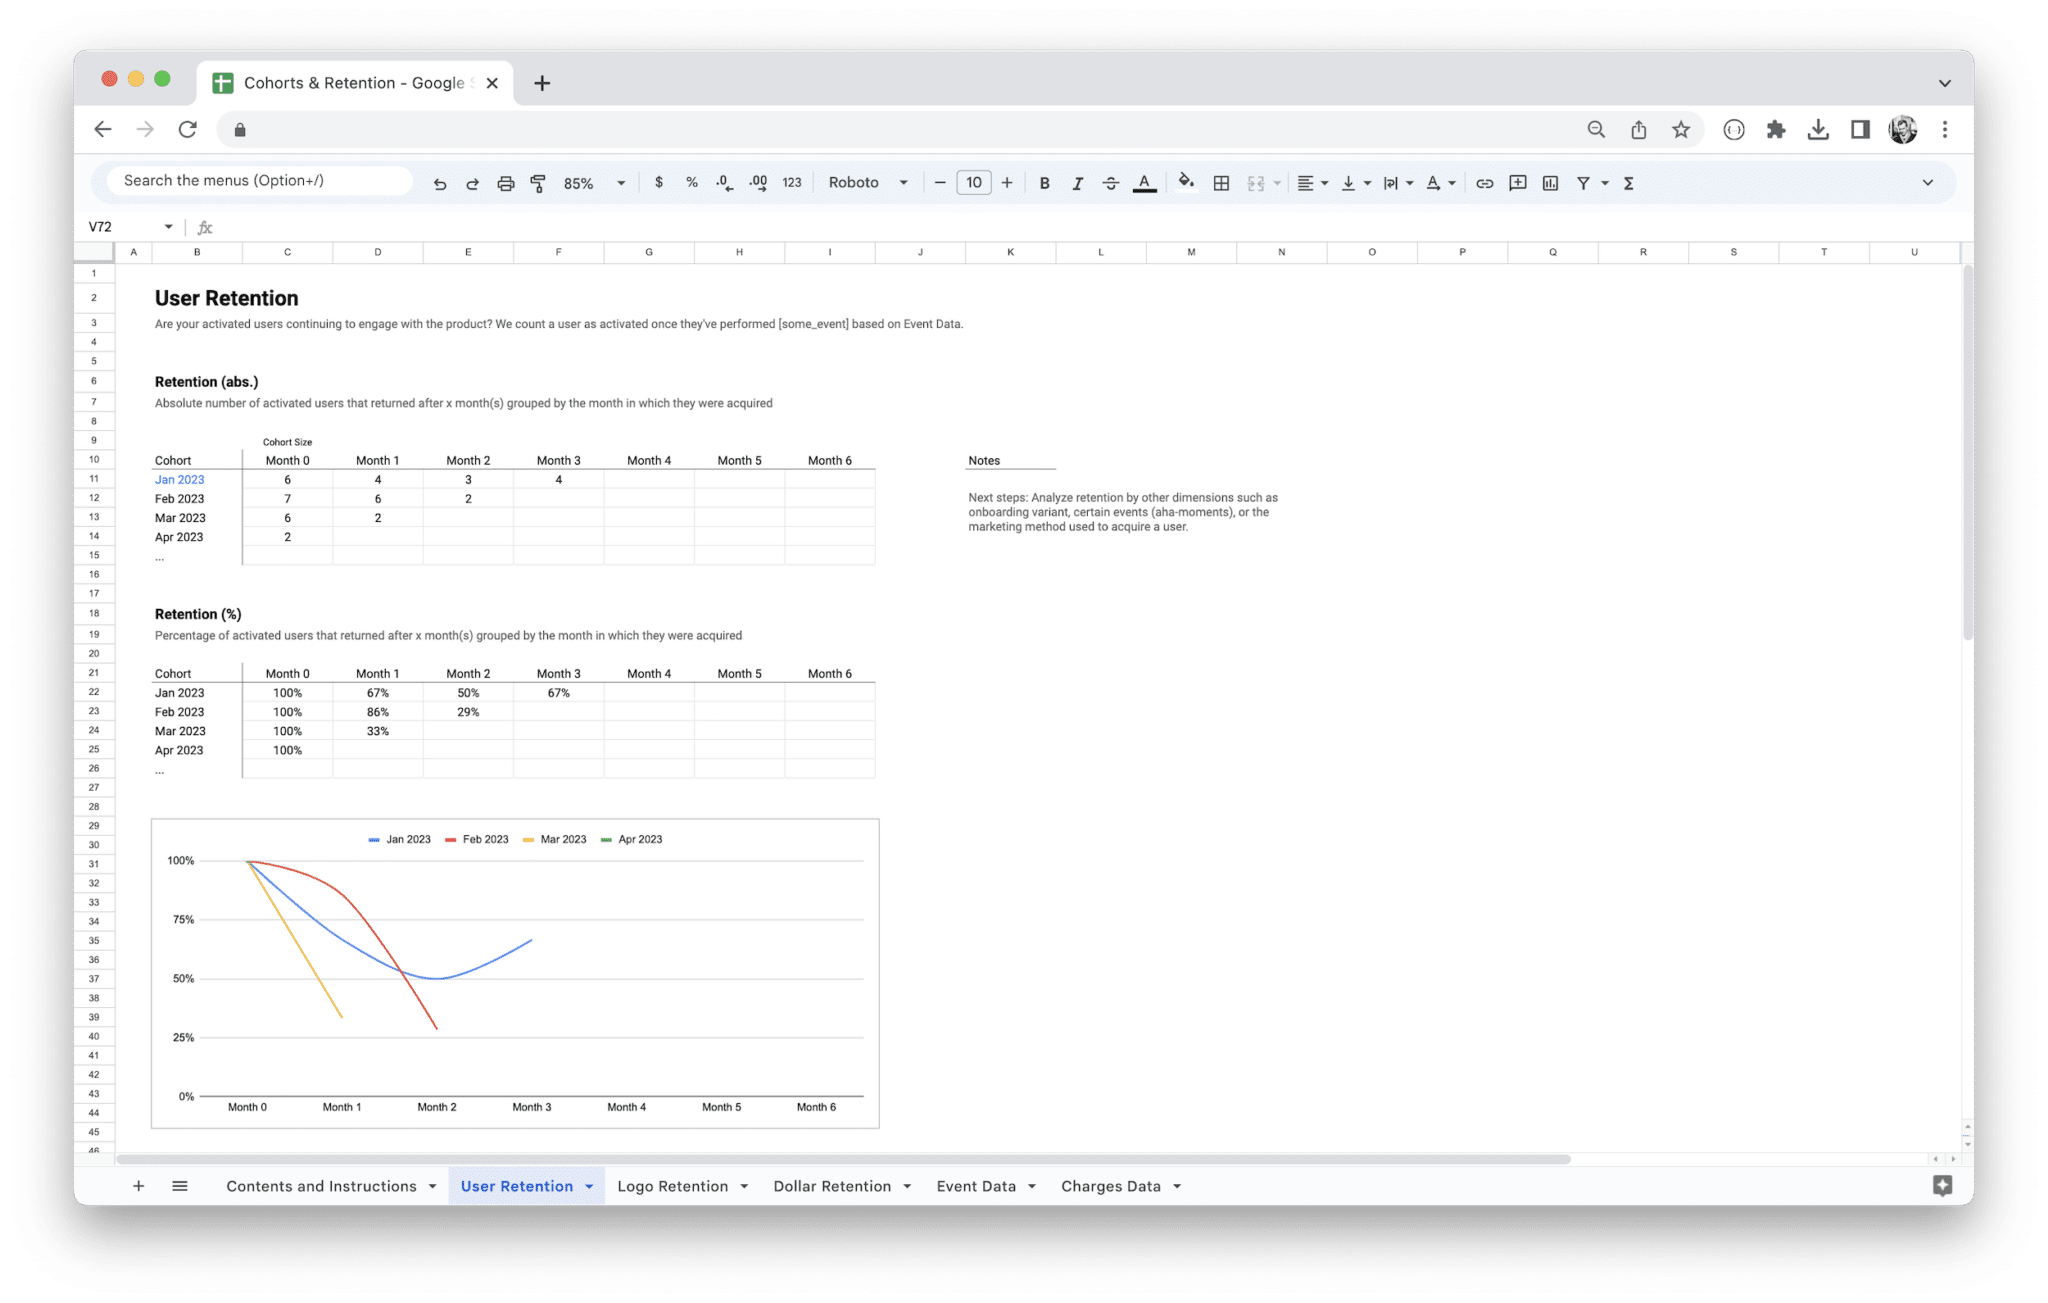
Cohort analysis is a powerful technique that allows businesses to understand and analyze the behavior and characteristics of specific groups of customers over time. It provides valuable insights into customer retention, engagement, and lifetime value. The Cohort Analysis Template in Google Sheets simplifies the process of conducting cohort analysis and helps businesses uncover trends and patterns within their customer base.
Step-by-Step Instructions for Using the Cohort Analysis Template
- Copy the Cohort Analysis Google Sheets Template to your Google Drive.
- Customize the template by entering your customer data, such as acquisition dates, cohort groups, and relevant metrics (e.g., revenue, engagement, or retention).
- Define the time period for your cohorts, such as monthly, quarterly, or yearly.
- Utilize the template’s formulas to automatically calculate cohort metrics, such as retention rates or average revenue per user.
- Visualize cohort data using charts or graphs within the template to identify trends and patterns.
- Analyze the behavior and performance of different cohorts over time to gain insights into customer retention, engagement, or revenue generation.
Interpreting and Analyzing Cohort Analysis Results
When interpreting and analyzing cohort analysis results using the template, consider the following:
- Look for trends and patterns: Examine how cohorts behave over time. Are there cohorts with consistently high retention rates? Are there cohorts that exhibit significant drops in engagement?
- Identify influencing factors: Analyze factors that may have influenced cohort behavior, such as marketing campaigns, product changes, or external events.
- Compare cohort performance: Compare metrics such as retention rates or revenue between different cohorts to identify segments with higher or lower performance.
- Explore segment-specific strategies: Develop targeted strategies for cohorts with lower performance to improve their engagement, retention, or revenue.
- Monitor cohort behavior over time: Continuously track and analyze cohort metrics to identify changes or trends that may require adjustments to your business strategies.
Leveraging Cohort Analysis Insights for Business Decision-Making
Cohort analysis provides actionable insights that can guide decision-making and drive business growth. Consider the following strategies when leveraging cohort analysis insights:
- Tailor marketing efforts: Use cohort analysis to identify cohorts with higher retention rates or lifetime value and adjust your marketing strategies to acquire more customers similar to those cohorts.
- Improve customer retention: Identify cohorts with lower retention rates and develop targeted retention strategies to improve their engagement and loyalty.
- Optimize product offerings: Analyze cohort behavior to understand which product features or offerings resonate most with specific customer segments and focus on enhancing those areas.
- Refine customer segmentation: Use cohort analysis to refine your customer segmentation strategy, ensuring that your marketing and communication efforts are tailored to specific cohorts with distinct characteristics or behaviors.
Software License Management Tool
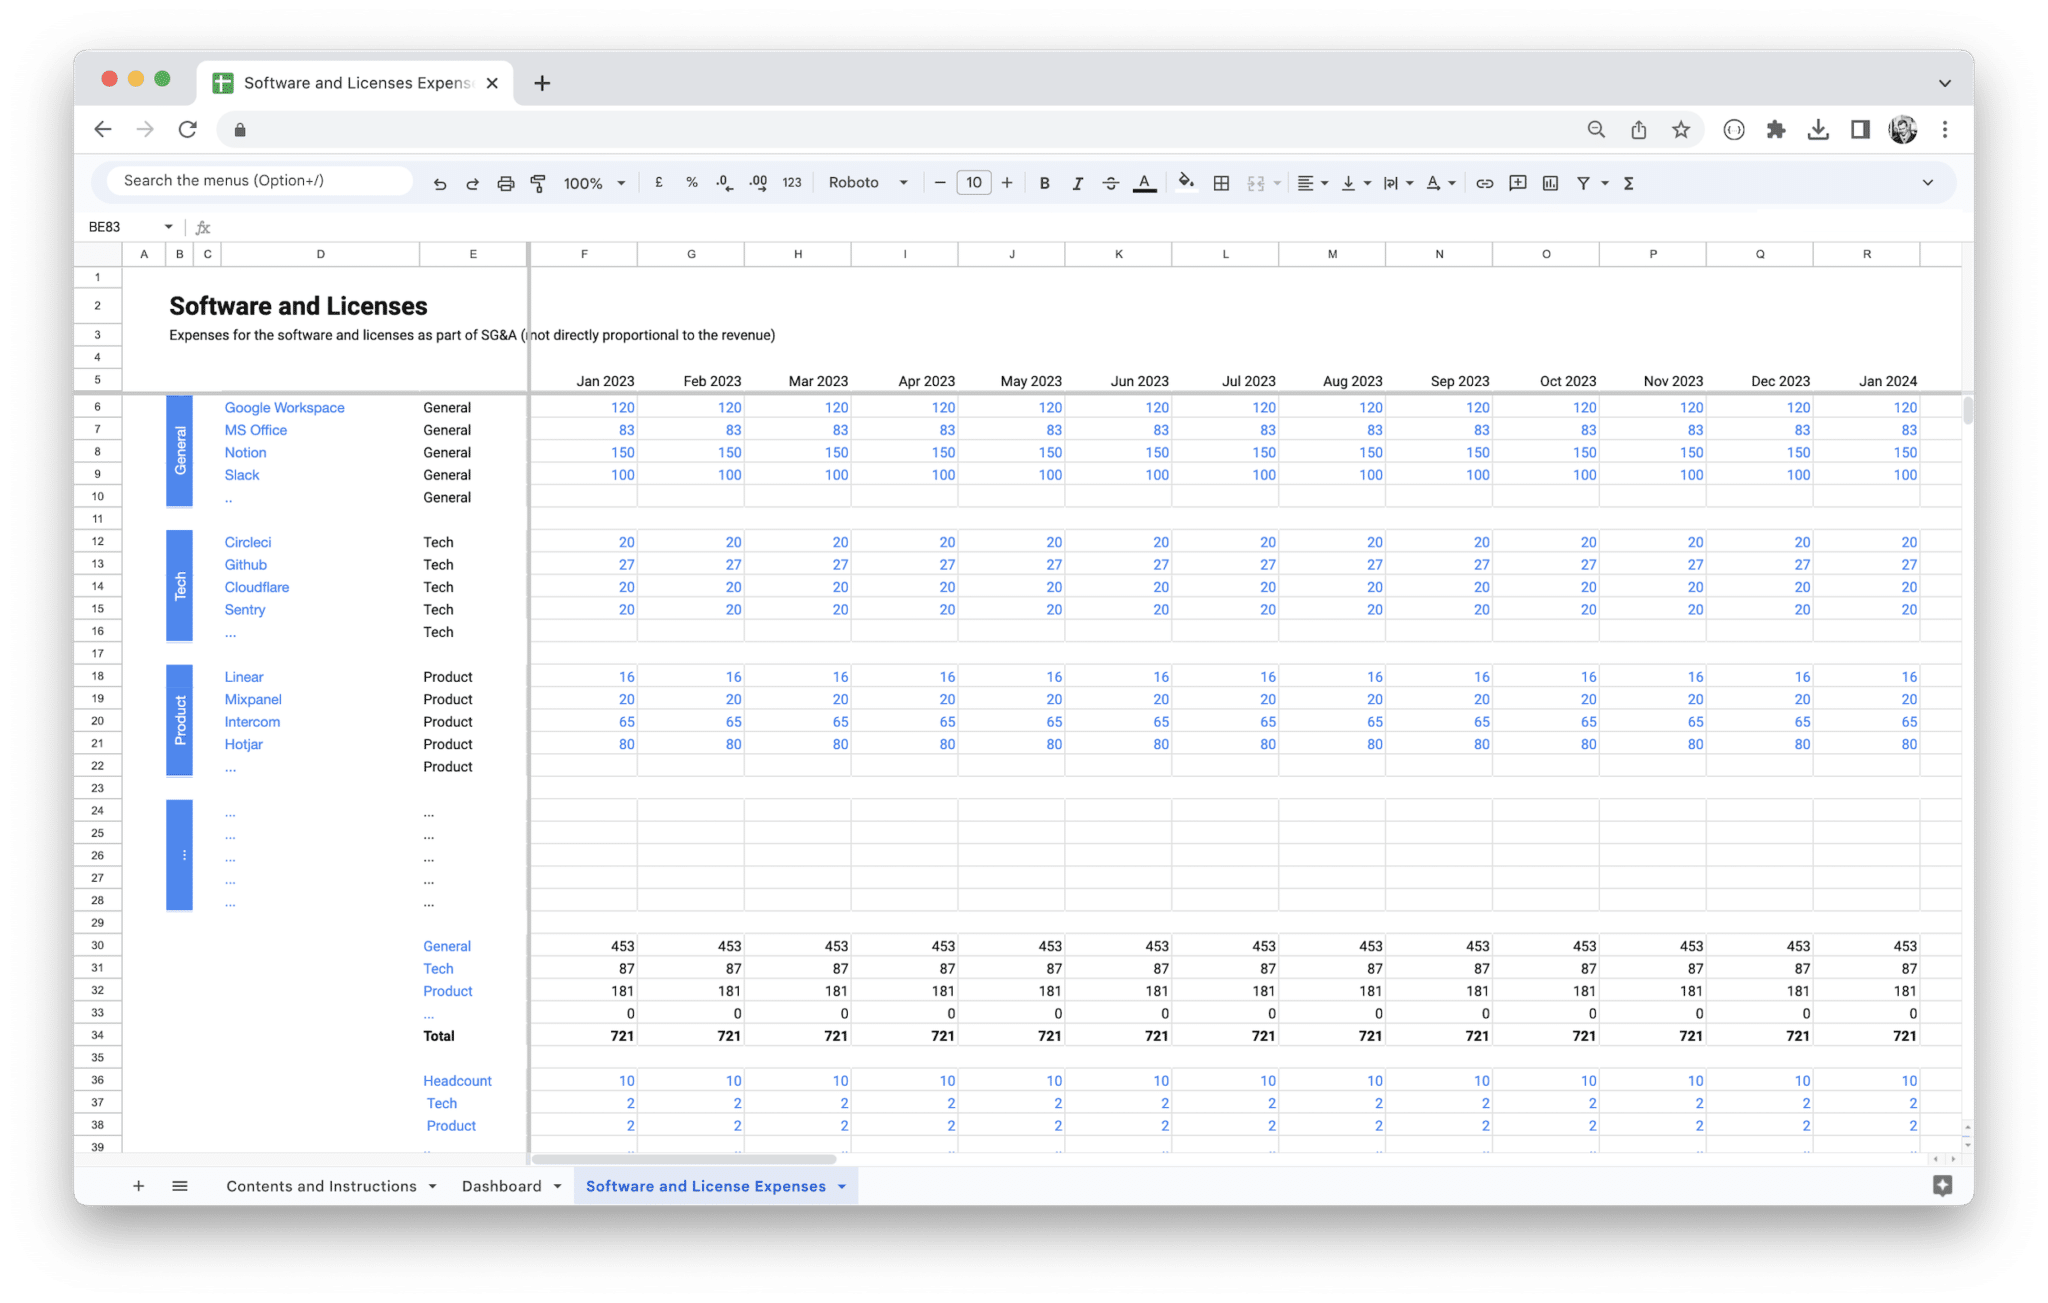
Software license management involves effectively tracking and managing software licenses within an organization. It helps businesses ensure compliance, optimize software usage, and control costs. The Software License Management Tool in Google Sheets provides a centralized solution for efficiently managing software licenses.
Utilizing the Software License Management Tool
- Access the Software License Management Tool in Google Sheets and copy it.
- Customize the template by entering details about the software licenses your organization owns, including license types, vendors, purchase dates, and license keys.
- Use the template to track license allocations to different users or departments within your organization.
- Set up reminders or notifications within the template to notify you of upcoming license renewals or expiration dates.
- Utilize the template’s reporting features to generate insights on license usage, costs, and compliance.
- Regularly update the template with new license information and ensure accurate record-keeping.
Features and Functionalities of the Software License Management Tool
The Software License Management Tool typically includes the following features and functionalities:
- License Inventory: A comprehensive list of software licenses owned by your organization, including details such as license types, vendors, purchase dates, and license keys.
- License Allocation: Track the allocation of licenses to different users or departments to ensure compliance and optimize license usage.
- Renewal Management: Set up reminders or notifications to stay informed about upcoming license renewals and avoid any disruptions.
- Reporting and Analytics: Utilize the template’s reporting capabilities to generate insights on license usage, costs, and compliance.
- License Expiration Tracking: Monitor license expiration dates to prevent any unintended usage of expired licenses.
Best Practices for Managing Software Licenses Using the Template
To effectively manage software licenses using the Software License Management Tool, consider the following best practices:
- Conduct regular audits: Periodically review and update the license inventory in the template to ensure accurate records of all software licenses.
- Implement a standardized naming convention: Use consistent naming conventions for licenses, vendors, and other relevant details to maintain consistency and ease of tracking.
- Centralize license documentation: Store relevant license agreements, invoices, and other documentation in a centralized location for easy reference.
- Regularly update license information: Update the template with new license purchases, renewals, or terminations to maintain an up-to-date record of your software licenses.
- Train and educate employees: Provide training and education to employees about the importance of software license compliance and the proper use of licensed software.
MRR Dashboard Template
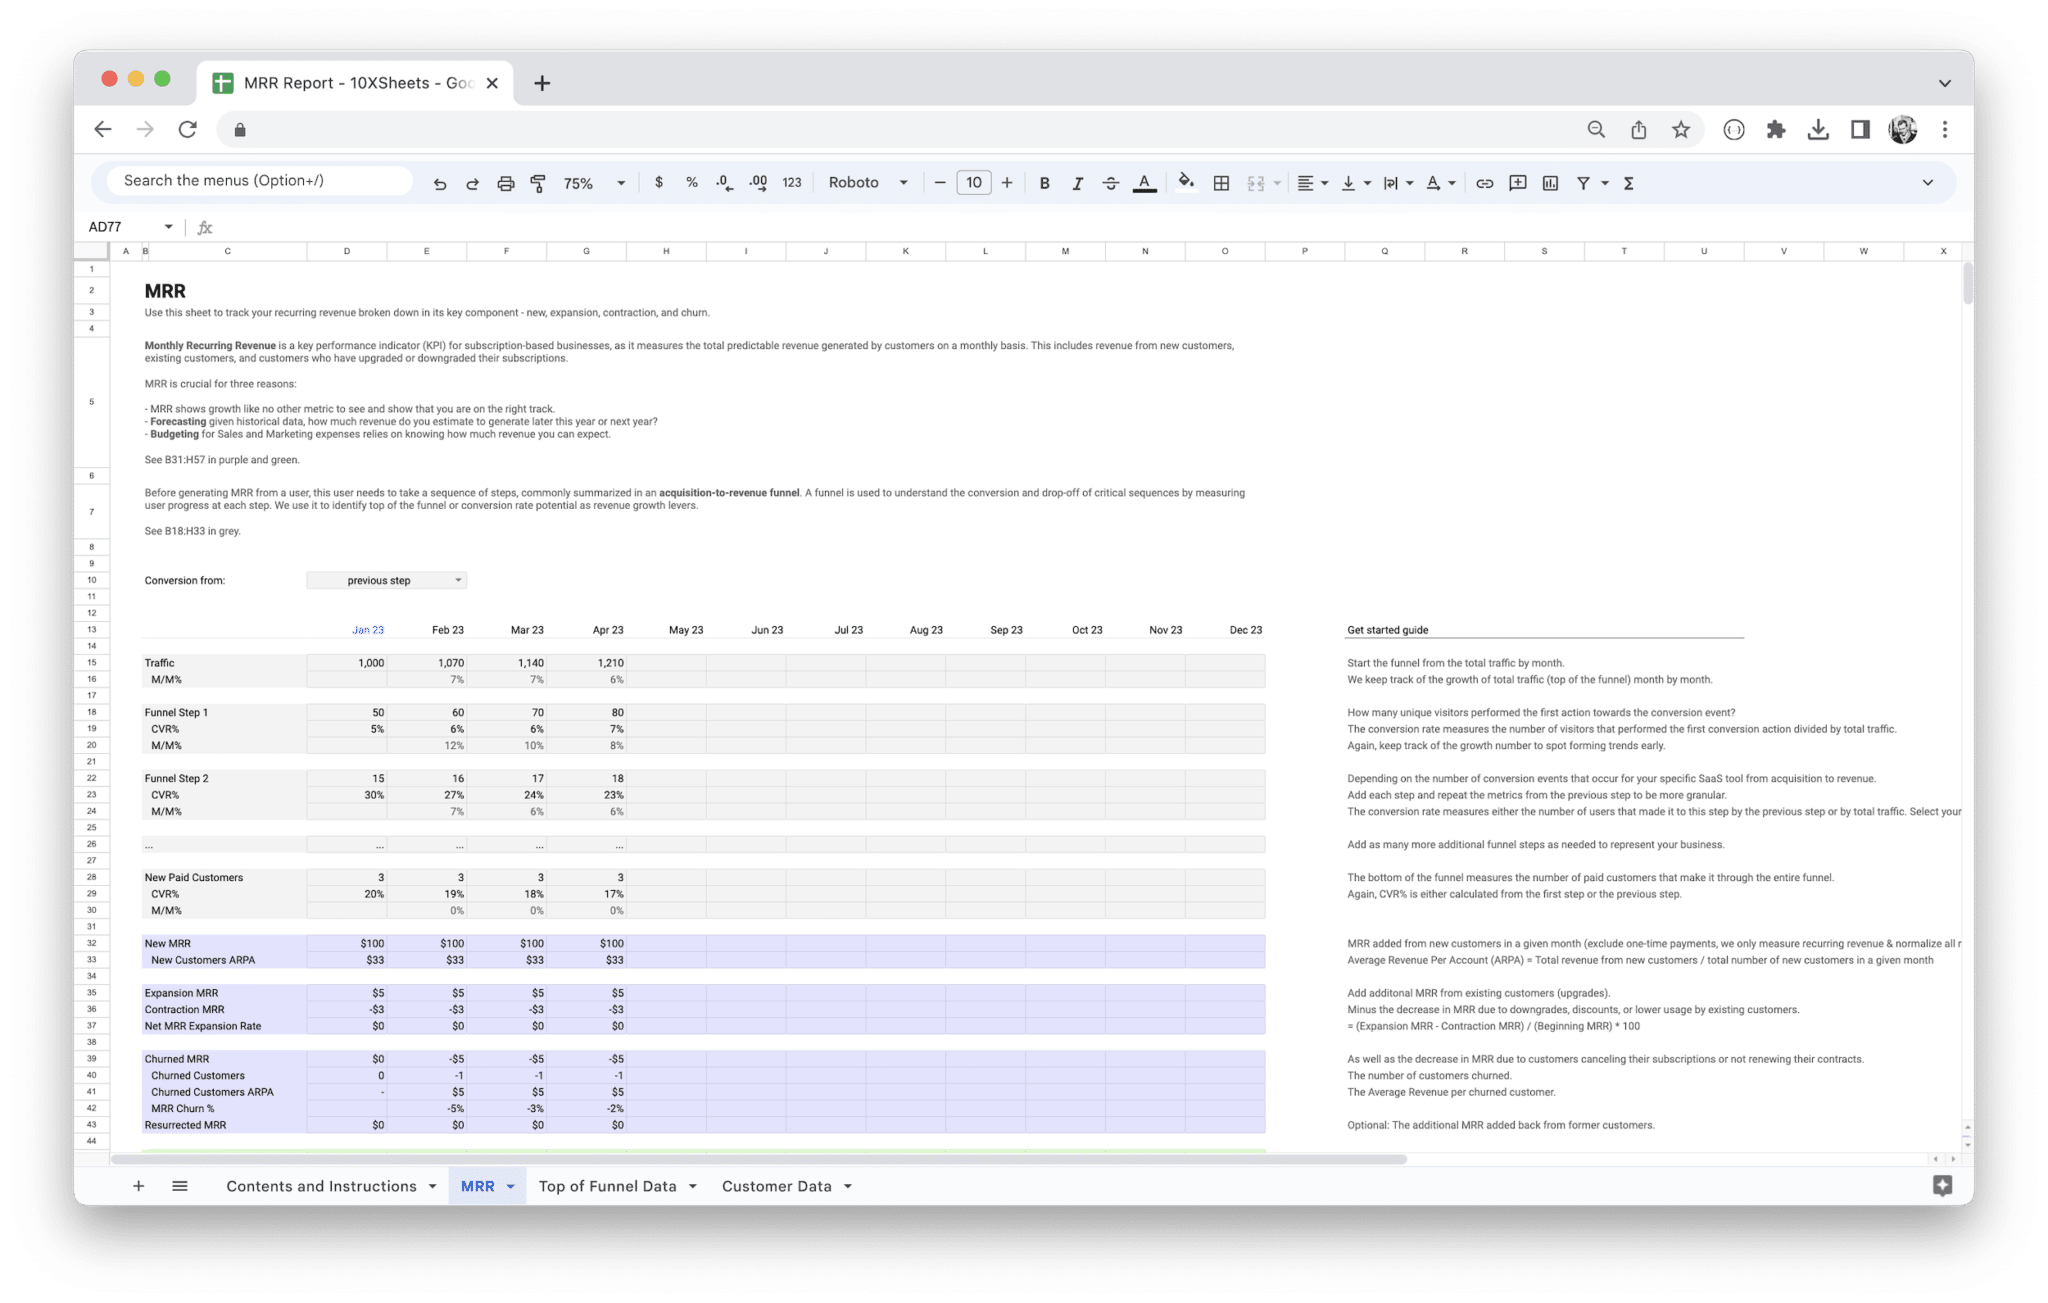
Monthly Recurring Revenue (MRR) is a key metric for subscription-based businesses. It represents the predictable and recurring revenue generated from subscription fees on a monthly basis. Tracking MRR is essential for monitoring business growth, forecasting revenue, and evaluating the success of pricing strategies. The MRR Dashboard Template in Google Sheets provides a visual representation of MRR trends and helps businesses make data-driven decisions.
How to Make the Most of the MRR Dashboard Template?
- Open the MRR Dashboard Template and make a copy of it.
- Customize the template by entering your MRR data, such as monthly subscription revenue, customer counts, and churn rates.
- Utilize the template’s formulas and features to automatically calculate MRR, net MRR growth, and other relevant metrics.
- Visualize MRR trends using charts and graphs within the template to gain insights into revenue performance.
- Track customer churn and analyze its impact on MRR to identify areas for improvement.
- Explore different views and time periods within the template to analyze MRR trends on a monthly, quarterly, or annual basis.
Key Metrics and Visualizations in the Dashboard Template
The MRR Dashboard Template typically includes the following key metrics and visualizations:
- Monthly Recurring Revenue (MRR): Represents the total revenue generated from subscriptions on a monthly basis.
- Net MRR Growth: Calculates the change in MRR over a specific time period, considering factors such as new subscriptions, upgrades, downgrades, and churn.
- Churn Rate: Measures the rate at which customers cancel or unsubscribe from your service.
- Average Revenue per User (ARPU): Calculates the average monthly revenue generated per customer.
- Visualizations: Charts and graphs that illustrate MRR trends, net MRR growth, churn rates, and ARPU.
Tracking and Analyzing MRR Trends Using the Template
When tracking and analyzing MRR trends using the template, consider the following:
- Monitor MRR growth over time: Analyze the overall MRR growth rate to understand the trajectory of your business.
- Identify factors influencing MRR changes: Evaluate the impact of new subscriptions, cancellations, upgrades, downgrades, and pricing changes on MRR.
- Analyze churn rates: Examine customer churn rates and identify potential reasons for churn to implement strategies to improve customer retention.
- Segment analysis: Analyze MRR trends by customer segments to identify areas of opportunity or potential challenges.
- Conduct cohort analysis: Perform cohort analysis to understand the MRR performance of different cohorts of customers over time.
- Utilize forecasts: Leverage forecasting capabilities within the template to predict future MRR and make informed business decisions.
Conclusion
In this list, we explored the power of top free Google Sheets templates for various business and personal needs. We covered templates for capital expenditure planning, user engagement tracking, CLV vs. CAC analysis, workforce planning, cohort analysis, software license management, and MRR tracking.
By leveraging these Google Sheets templates, you can enhance productivity, streamline processes, and make data-driven decisions. Whether you’re a business professional, an entrepreneur, or a student, Google Sheets templates provide a valuable resource to save time, stay organized, and achieve your goals.
So, why wait? Start utilizing these top free Google Sheets templates today and unlock their potential to transform the way you work, collaborate, and achieve success. Remember, customization is key—tailor the templates to your specific needs, regularly update them with relevant data, and monitor your progress along the way. Here’s to your continued success with Google Sheets templates!
Get Started With a Prebuilt Template!
Looking to streamline your business financial modeling process with a prebuilt customizable template? Say goodbye to the hassle of building a financial model from scratch and get started right away with one of our premium templates.
- Save time with no need to create a financial model from scratch.
- Reduce errors with prebuilt formulas and calculations.
- Customize to your needs by adding/deleting sections and adjusting formulas.
- Automatically calculate key metrics for valuable insights.
- Make informed decisions about your strategy and goals with a clear picture of your business performance and financial health.


